
Compare Keynote Finan. with Similar Stocks
Stock DNA
Non Banking Financial Company (NBFC)
INR 136 Cr (Micro Cap)
21.00
20
0.39%
0.03
4.71%
0.98
Total Returns (Price + Dividend) 
Latest dividend: 1 per share ex-dividend date: Sep-19-2025
Risk Adjusted Returns v/s
Returns Beta

News

Keynote Financial Services Ltd is Rated Strong Sell
Keynote Financial Services Ltd is rated Strong Sell by MarketsMOJO, with this rating last updated on 26 May 2026. However, the analysis and financial metrics presented here reflect the stock’s current position as of 15 June 2026, providing investors with the latest insights into the company’s performance and outlook.
Read full news article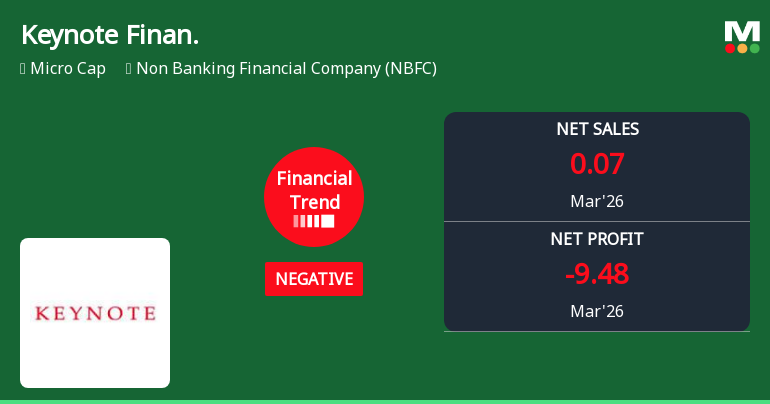
Keynote Financial Services Ltd Reports Mixed Quarterly Results Amid Margin Pressures
Keynote Financial Services Ltd, a micro-cap player in the Non Banking Financial Company (NBFC) sector, reported its quarterly results for March 2026, revealing a complex financial picture. While net sales have surged impressively, profitability metrics have deteriorated sharply, signalling margin pressures and operational challenges that have shifted the company’s financial trend from negative to flat.
Read full news article
Keynote Financial Services Ltd is Rated Strong Sell
Keynote Financial Services Ltd is rated Strong Sell by MarketsMOJO, with this rating last updated on 26 May 2026. However, the analysis and financial metrics discussed here reflect the company’s current position as of 02 June 2026, providing investors with the latest insights into its performance and outlook.
Read full news article Announcements
Newspaper Advertisement Regarding Transfer Of Equity Shares To IEPF For The FY 2018-2019.
05-Jun-2026 | Source : BSECopy of Newspaper Advertisement.
Announcement under Regulation 30 (LODR)-Newspaper Publication
01-Jun-2026 | Source : BSECopy of Newspaper Publication for Audited Financial Results for the quarter and year ended 31st March 2026
Re-Appointment Of Mrs. Rinku Suchanti As Executive Director Of The Company.
29-May-2026 | Source : BSERe-appointment of Mrs. Rinku Suchanti as a Executive Director of the Company.
Corporate Actions

No Upcoming Board Meetings

Keynote Financial Services Ltd has declared 10% dividend, ex-date: 19 Sep 25

No Splits history available

No Bonus history available

No Rights history available
Quality key factors
Valuation key factors
Technicals key factors
 Technical Indicator Scale: Bearish, Mildly Bearish, Sideways, Mildly Bullish, Bullish Turned
 Shareholding Snapshot : Mar 2026
Shareholding Compare (%holding)
Promoters
None
Held by 0 Schemes
Held by 1 FIIs (9.26%)
Nss Digital Media Limited (55.91%)
India Max Investment Fund Limited (9.26%)
15.16%
Quarterly Results Snapshot (Consolidated) - Mar'26 - QoQ

QoQ Growth in quarter ended Mar 2026 is -99.44% vs 883.65% in Dec 2025
QoQ Growth in quarter ended Mar 2026 is -311.14% vs 593.41% in Dec 2025
Half Yearly Results Snapshot (Consolidated) - Sep'25
Growth in half year ended Sep 2025 is -40.09% vs 20.02% in Sep 2024
Growth in half year ended Sep 2025 is -29.95% vs 31.36% in Sep 2024
Nine Monthly Results Snapshot (Consolidated) - Dec'25
YoY Growth in nine months ended Dec 2025 is -11.97% vs -10.08% in Dec 2024
YoY Growth in nine months ended Dec 2025 is -27.49% vs -0.76% in Dec 2024
Annual Results Snapshot (Consolidated) - Mar'26

YoY Growth in year ended Mar 2026 is -6.00% vs -40.15% in Mar 2025
YoY Growth in year ended Mar 2026 is -54.29% vs -45.61% in Mar 2025
About Keynote Financial Services Ltd

Company Coordinates


