
Compare Nitin Spinners with Similar Stocks
Stock DNA
Garments & Apparels
INR 3,169 Cr (Small Cap)
18.00
25
0.54%
0.76
12.07%
2.14
Total Returns (Price + Dividend) 
Latest dividend: 3 per share ex-dividend date: Aug-29-2025
Risk Adjusted Returns v/s
Returns Beta

News
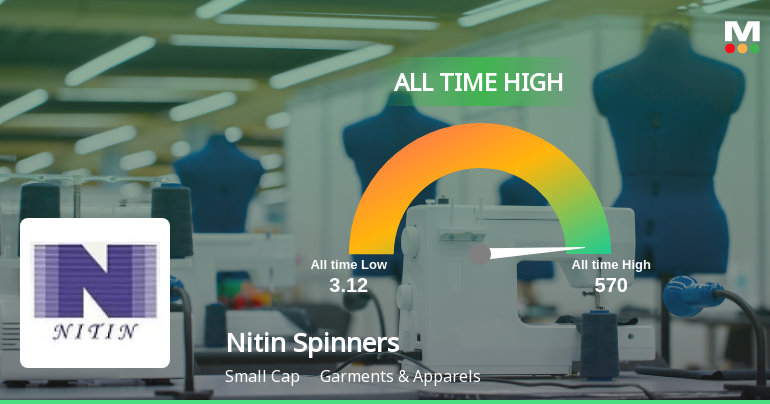
Nitin Spinners Ltd Hits All-Time High of Rs 570 as Momentum Builds Across Timeframes
Extending its recent rally, Nitin Spinners Ltd surged to a fresh all-time high of Rs 570 on 19 Jun 2026, outperforming both its sector and the broader market indices with a 2.07% gain on the day.
Read full news article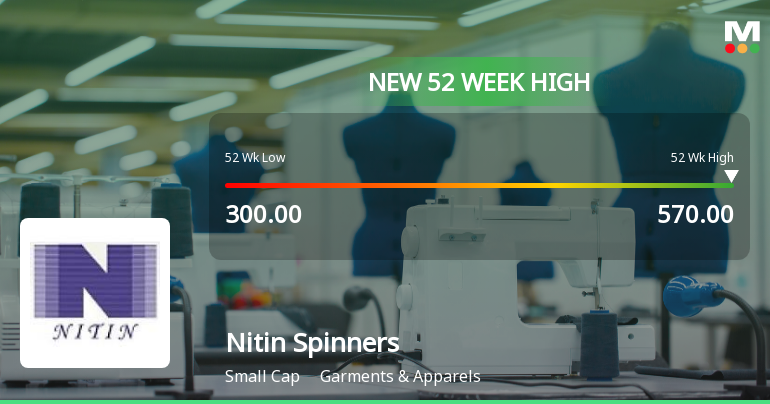
Broad-Based Technical Strength Lifts Nitin Spinners Ltd to 52-Week High of Rs 570
With a decisive surge to Rs 570 on 19 Jun 2026, Nitin Spinners Ltd has reached a fresh 52-week and all-time high, marking a 51.02% gain over the past year. This milestone comes amid a backdrop of strong technical momentum, even as the broader Sensex trades lower, underscoring the stock's standout performance in the Garments & Apparels sector.
Read full news article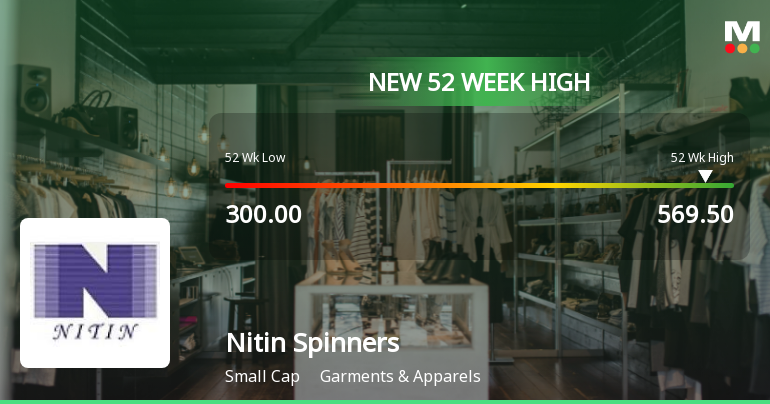
Broad-Based Technical Strength Lifts Nitin Spinners Ltd to 52-Week High of Rs 569.5
With a decisive breakthrough to Rs 569.5 on 15 Jun 2026, Nitin Spinners Ltd has reached a fresh 52-week and all-time high, marking a 41.08% gain over the past year. This milestone comes amid a backdrop of strong technical momentum and sustained outperformance versus the broader market, which has declined by 5.54% over the same period.
Read full news article Announcements
Announcement under Regulation 30 (LODR)-Analyst / Investor Meet - Intimation
13-Jun-2026 | Source : BSEIntimation of Schedule of Analyst/Institutional Investor Meeting
Announcement under Regulation 30 (LODR)-Earnings Call Transcript
14-May-2026 | Source : BSETRANSCRIPT OF ANALYST/INVESTOR EARNINGS CALL HELD ON 11.05.2026
Analyst / Investor Earning Call Audio Recording
11-May-2026 | Source : BSEAnalyst / Investor Earning Call Audio Recording
Corporate Actions

No Upcoming Board Meetings

Nitin Spinners Ltd has declared 30% dividend, ex-date: 29 Aug 25

No Splits history available

No Bonus history available

No Rights history available
Quality key factors
Valuation key factors
Technicals key factors
 Technical Indicator Scale: Bearish, Mildly Bearish, Sideways, Mildly Bullish, Bullish Turned
 Shareholding Snapshot : Mar 2026
Shareholding Compare (%holding)
Promoters
None
Held by 5 Schemes (14.08%)
Held by 40 FIIs (1.09%)
Redial Trading And Investment Private Limited (32.18%)
Bandhan Small Cap Fund (6.3%)
22.45%
Quarterly Results Snapshot (Standalone) - Mar'26 - QoQ

QoQ Growth in quarter ended Mar 2026 is 7.38% vs 5.34% in Dec 2025
QoQ Growth in quarter ended Mar 2026 is 29.16% vs 27.65% in Dec 2025
Half Yearly Results Snapshot (Standalone) - Sep'25

Growth in half year ended Sep 2025 is -4.43% vs 20.01% in Sep 2024
Growth in half year ended Sep 2025 is -10.10% vs 39.08% in Sep 2024
Nine Monthly Results Snapshot (Standalone) - Dec'25
YoY Growth in nine months ended Dec 2025 is -4.47% vs 17.08% in Dec 2024
YoY Growth in nine months ended Dec 2025 is -6.88% vs 39.75% in Dec 2024
Annual Results Snapshot (Standalone) - Mar'26
YoY Growth in year ended Mar 2026 is -2.78% vs 13.77% in Mar 2025
YoY Growth in year ended Mar 2026 is 1.21% vs 33.39% in Mar 2025
About Nitin Spinners Ltd

Company Coordinates


