
Compare Nitin Spinners with Similar Stocks
Dashboard
High Management Efficiency with a high ROCE of 16.37%
Positive results in Mar 26
With ROCE of 11.8, it has a Attractive valuation with a 1.6 Enterprise value to Capital Employed
Increasing Participation by Institutional Investors
Market Beating performance in long term as well as near term
Stock DNA
Garments & Apparels
INR 3,011 Cr (Small Cap)
17.00
25
0.56%
0.76
12.07%
2.04
Total Returns (Price + Dividend) 
Latest dividend: 3 per share ex-dividend date: Aug-29-2025
Risk Adjusted Returns v/s
Returns Beta

News

Nitin Spinners Ltd Technical Momentum Shifts Amid Mixed Indicator Signals
Nitin Spinners Ltd, a small-cap player in the Garments & Apparels sector, has experienced a nuanced shift in its technical momentum, reflecting a blend of bullish and bearish signals across key indicators. Despite a slight dip in price, the company’s upgraded MarketsMOJO grade to 'Buy' underscores growing investor confidence amid evolving market dynamics.
Read full news article
Nitin Spinners Ltd Upgraded to Buy on Strong Technical and Financial Performance
Nitin Spinners Ltd, a small-cap player in the Garments & Apparels sector, has seen its investment rating upgraded from Hold to Buy by MarketsMOJO as of 27 Jul 2026. This upgrade reflects significant improvements across four key parameters: quality, valuation, financial trend, and technicals. The company’s robust quarterly performance, attractive valuation metrics, positive technical signals, and strong long-term returns underpin this enhanced outlook.
Read full news article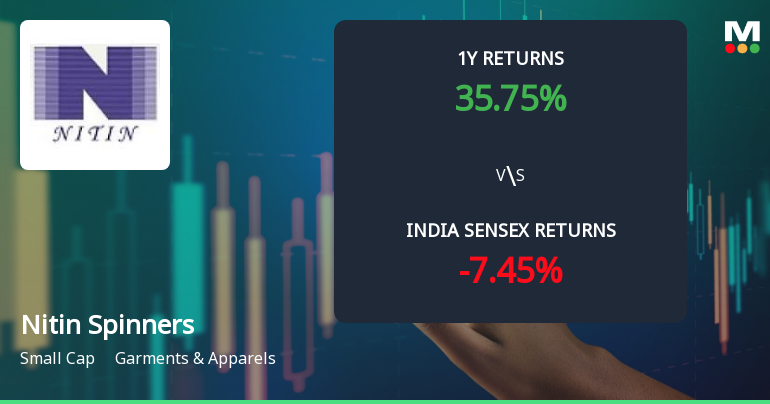
Nitin Spinners Ltd Technical Momentum Shifts Signal Bullish Outlook Amid Market Volatility
Nitin Spinners Ltd, a small-cap player in the Garments & Apparels sector, has witnessed a notable shift in its technical momentum, moving from a mildly bullish stance to a more confident bullish trend. This transition is underpinned by a confluence of positive signals across key technical indicators including MACD, moving averages, and the KST oscillator, suggesting an improving price momentum that investors should closely monitor.
Read full news article Announcements
Announcement under Regulation 30 (LODR)-Newspaper Publication
20-Jul-2026 | Source : BSESubmission of News Paper publication for the attention of Equity Shareholders of the Company regarding transfer of Equity Shares of the Company to the Demat Account of the Investors Education and Protection Fund (IEPF) Authority
Closure of Trading Window
29-Jun-2026 | Source : BSEINTIMATION OF CLOSURE OF TRADING WINDOW
Announcement under Regulation 30 (LODR)-Credit Rating
22-Jun-2026 | Source : BSEUPGRADATION OF CREDIT RATING BY CARE RATING LIMITED
Corporate Actions

No Upcoming Board Meetings

Nitin Spinners Ltd has declared 30% dividend, ex-date: 29 Aug 25

No Splits history available

No Bonus history available

No Rights history available
Quality key factors
Valuation key factors
Technicals key factors
 Technical Indicator Scale: Bearish, Mildly Bearish, Sideways, Mildly Bullish, Bullish Turned
 Shareholding Snapshot : Jun 2026
Shareholding Compare (%holding)
Promoters
None
Held by 5 Schemes (14.52%)
Held by 50 FIIs (1.92%)
Redial Trading And Investment Private Limited (32.18%)
Bandhan Small Cap Fund (5.3%)
21.36%
Quarterly Results Snapshot (Standalone) - Mar'26 - QoQ

QoQ Growth in quarter ended Mar 2026 is 7.38% vs 5.34% in Dec 2025
QoQ Growth in quarter ended Mar 2026 is 29.16% vs 27.65% in Dec 2025
Half Yearly Results Snapshot (Standalone) - Sep'25

Growth in half year ended Sep 2025 is -4.43% vs 20.01% in Sep 2024
Growth in half year ended Sep 2025 is -10.10% vs 39.08% in Sep 2024
Nine Monthly Results Snapshot (Standalone) - Dec'25
YoY Growth in nine months ended Dec 2025 is -4.47% vs 17.08% in Dec 2024
YoY Growth in nine months ended Dec 2025 is -6.88% vs 39.75% in Dec 2024
Annual Results Snapshot (Standalone) - Mar'26
YoY Growth in year ended Mar 2026 is -2.78% vs 13.77% in Mar 2025
YoY Growth in year ended Mar 2026 is 1.21% vs 33.39% in Mar 2025
About Nitin Spinners Ltd

Company Coordinates


