
Compare Puretrop Fruits with Similar Stocks
Dashboard
Weak Long Term Fundamental Strength with a -8.76% CAGR growth in Operating Profits over the last 5 years
- The company has been able to generate a Return on Equity (avg) of 7.51% signifying low profitability per unit of shareholders funds
With ROE of 7.3, it has a Expensive valuation with a 1.1 Price to Book Value
Reducing Promoter Confidence
Stock DNA
Other Agricultural Products
INR 124 Cr (Micro Cap)
15.00
47
0.00%
-0.32
7.30%
1.13
Total Returns (Price + Dividend) 
Latest dividend: 1 per share ex-dividend date: Sep-21-2016
Risk Adjusted Returns v/s
Returns Beta

News
Puretrop Fruits Ltd is Rated Sell
Puretrop Fruits Ltd is rated 'Sell' by MarketsMOJO, with this rating last updated on 13 April 2026. However, the analysis and financial metrics discussed here reflect the stock's current position as of 08 July 2026, providing investors with an up-to-date perspective on the company’s fundamentals, valuation, financial trends, and technical outlook.
Read full news article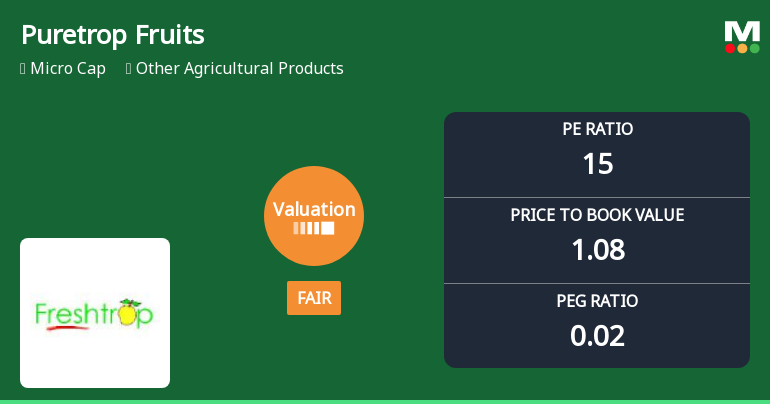
Puretrop Fruits Ltd Valuation Shifts to Fair; Market Performance and Peer Comparison
Puretrop Fruits Ltd, a micro-cap player in the Other Agricultural Products sector, has witnessed a notable shift in its valuation parameters, moving from a very expensive rating to a fair valuation. This change reflects evolving market perceptions amid mixed financial performance and sector dynamics, prompting a reassessment of its price attractiveness relative to peers and historical benchmarks.
Read full news article
Puretrop Fruits Ltd is Rated Sell
Puretrop Fruits Ltd is rated 'Sell' by MarketsMOJO, with this rating last updated on 13 April 2026. However, the analysis and financial metrics discussed here reflect the stock's current position as of 27 June 2026, providing investors with an up-to-date view of the company’s fundamentals, valuation, financial trends, and technical outlook.
Read full news article Announcements
Closure of Trading Window
25-Jun-2026 | Source : BSEClosure of trading window for the quarter ended 30th June 2026.
Intimation Under Regulation 30 Of SEBI(LODR) 2015 (Re-Constitution Of Committees.)
22-Jun-2026 | Source : BSEIntimation under Regulation 30 of SEBI(LODR) 2015(Re-constitution of Various committees.)
Announcement under Regulation 30 (LODR)-Resignation of Director
18-Jun-2026 | Source : BSEIntimation under Regulation 30 of SEBI(LODR) Regulations 2015- Resignation of Independent Director of the Company
Corporate Actions

No Upcoming Board Meetings

Puretrop Fruits Ltd has declared 10% dividend, ex-date: 21 Sep 16

No Splits history available

Puretrop Fruits Ltd has announced 1:1 bonus issue, ex-date: 03 Jan 08

No Rights history available
Quality key factors
Valuation key factors
Technicals key factors
 Technical Indicator Scale: Bearish, Mildly Bearish, Sideways, Mildly Bullish, Bullish Turned
 Shareholding Snapshot : Mar 2026
Shareholding Compare (%holding)
Promoters
None
Held by 0 Schemes
Held by 0 FIIs
Freshcap Foodstuff Llp (19.9%)
None
28.87%
Quarterly Results Snapshot (Standalone) - Mar'26 - QoQ

QoQ Growth in quarter ended Mar 2026 is 54.23% vs -1.93% in Dec 2025
QoQ Growth in quarter ended Mar 2026 is 38.01% vs -23.45% in Dec 2025
Half Yearly Results Snapshot (Standalone) - Sep'25
Growth in half year ended Sep 2025 is -15.19% vs -48.97% in Sep 2024
Growth in half year ended Sep 2025 is 25.48% vs 16.51% in Sep 2024
Nine Monthly Results Snapshot (Standalone) - Dec'25
YoY Growth in nine months ended Dec 2025 is -3.83% vs -43.88% in Dec 2024
YoY Growth in nine months ended Dec 2025 is 61.69% vs -77.82% in Dec 2024
Annual Results Snapshot (Standalone) - Mar'26
YoY Growth in year ended Mar 2026 is 9.12% vs 4.84% in Mar 2025
YoY Growth in year ended Mar 2026 is 113.06% vs -80.20% in Mar 2025
About Puretrop Fruits Ltd

Company Coordinates


