Asian Star Co.

  • Market Cap: Micro Cap
  • Industry: Gems, Jewellery And Watches
  • ISIN: INE194D01017
  • NSEID: ASTAR
  • BSEID: 531847
INR
600.50
0.95 (0.16%)
BSENSE

Aug 14, 04:01 PM

BSE+NSE Vol: 65

  • Price Points
  • Score
  • Mojo Parameters
  • Total Return
  • News and Corporate Actions
  • Key factors
  • Shareholding
  • Financials
  • CompanyCV
stock-summaryPrice Point
High/Low

1Day

52 Week

Valuation
Technical
Day's Volume

CASH

65 (-65.05%) Volume

Shareholding (Jun 2026)

FII

0.00%

Held by 0 FIIs

DII

4.21%

Held by 1 DIIs

Promoter

74.66%

Should I buy, sell or hold Asian Star Company Ltd?

15-Aug-2026

Why is Asian Star Company Ltd falling/rising?

15-Aug-2026

As of 15-Aug, the stock price of Asian Star Company Ltd is rising to 600.50, driven by a 3.53% gain over the past week and increased investor participation. This upward trend is supported by recent positive performance and a stable trading environment, despite being lower than longer-term moving averages.

As of 15-Aug, the stock price of Asian Star Company Ltd is rising, currently at 600.50, with a change of 0.95 (0.16%) upwards. This increase can be attributed to several factors. Firstly, the stock has shown a positive performance over the past week, gaining 3.53%, while the benchmark Sensex has declined by 0.62% during the same period. Additionally, the stock has been gaining for the last two consecutive days, indicating a potential upward trend.<BR><BR>Moreover, there has been a notable increase in investor participation, with delivery volume on 13 August rising by 39.83% compared to the 5-day average. This suggests that more investors are willing to buy and hold the stock, contributing to its upward movement. While the stock's moving averages indicate that it is higher than the 5-day moving average, it remains lower than the longer-term moving averages (20-day, 50-day, 100-day, and 200-day), which may suggest a potential for recovery in the short term.<BR><BR>Overall, the combination of recent gains, increased investor participation, and a relatively stable trading environment has contributed to the rising stock price of Asian Star Company Ltd.

View full answer

Who are in the management team of Asian Star Co.?

14-Aug-2026

The management team of Asian Star Co. includes Vipul P Shah (Managing Director & CFO), Arvind T Shah (Chairman), and several directors, including independent members. They oversee the company's strategic direction and management.

The management team of Asian Star Co. includes the following individuals:<BR><BR>1. **Vipul P Shah** - Managing Director & CFO<BR>2. **Dharmesh D Shah** - Director<BR>3. **Arvind T Shah** - Chairman, Whole-Time Director & CFO<BR>4. **Priyanshu A Shah** - Director<BR>5. **K Mohanram Pai** - Independent Director<BR>6. **Apurva R Shah** - Independent Director<BR>7. **Milind H Gandhi** - Independent Director<BR>8. **M R Nayak** - Independent Director<BR>9. **Rahil V Shah** - Executive Director<BR>10. **Neha Gada** - Independent Director<BR>11. **Jayantilal Dudhabhai Parmar** - Independent Director<BR>12. **Pujadevi R Chaurasia** - Company Secretary & Compliance Officer<BR><BR>This team is responsible for the strategic direction and management of the company.

View full answer

What does Asian Star Co. do?

14-Aug-2026

Asian Star Company Ltd specializes in diamond cutting and polishing, jewellery manufacturing and retailing, and wind power generation in India. It is a micro-cap company with recent net sales of 638 Cr and a market cap of INR 951 Cr.

Overview:<BR>Asian Star Company Ltd is a leading player in the gems, jewellery, and watches industry, primarily engaged in diamond cutting and polishing, jewellery manufacturing and retailing, and also involved in electricity generation through wind power in India. It falls under the micro-cap market category.<BR><BR>History:<BR>Asian Star Company was incorporated in November 1971 as a partnership firm and became a public limited company in March 1995, obtaining its Certificate of Commencement of business in the same month. The latest quarterly results reported net sales and profit for June 2026.<BR><BR>Financial Snapshot:<BR>Most recent Net Sales: 638 Cr (Quarterly Results - Jun 2026) <BR>Most recent Net Profit: 12 Cr (Quarterly Results - Jun 2026) <BR>Market-cap value: INR 951 Cr (Micro Cap)<BR><BR>Key Metrics:<BR>P/E: 24.00 <BR>Industry P/E: 52 <BR>Dividend Yield: 0.25% <BR>Debt Equity: 0.00 <BR>Return on Equity: 0.00% <BR>Price to Book: 0.57 <BR><BR>Contact Details:<BR>Address: 114-C Mittal Court, Nariman Point Mumbai Maharashtra : 400021 <BR>Tel: 91-22-62444111 <BR>Email: info@asianstargroup.com <BR>Website: http://www.asiangroup.com

View full answer

Who are the peers of the Asian Star Co.?

14-Aug-2026

Asian Star Co.'s peers include Shanti Gold, T B Z, Motisons Jewel, and others, with varying management and growth risks. In terms of returns, T B Z leads with 31.80% over one year, while Asian Star Co. has a return of -19.79%.

Peers: The peers of Asian Star Co. are Shanti Gold, T B Z, Motisons Jewel, Renaiss. Global, Radhika Jeweltec, Manoj Vaibhav, PNGS Gargi FJ, RBZ Jewellers Lt, and Utssav CZ Gold.<BR><BR>Quality Snapshot: Excellent management risk is observed at PNGS Gargi FJ, Shanti Gold, T B Z, RBZ Jewellers Lt, and Utssav CZ Gold, while Average management risk is found at Motisons Jewel, Renaiss. Global, Asian Star Co., Radhika Jeweltec, Manoj Vaibhav. Below Average management risk is noted for Renaiss. Global. In terms of growth, Excellent growth is seen at Shanti Gold, PNGS Gargi FJ, T B Z, RBZ Jewellers Lt, and Utssav CZ Gold, while Good growth is found at T B Z, Average growth at Radhika Jeweltec, and Below Average growth at Asian Star Co., Motisons Jewel, and Manoj Vaibhav. Capital Structure ratings show Excellent at Motisons Jewel, Radhika Jeweltec, and PNGS Gargi FJ, Good at Asian Star Co., and Below Average at Shanti Gold, T B Z, and Renaiss. Global.<BR><BR>Return Snapshot: The peer with the highest 1-year return is T B Z at 31.80%, while the lowest is Radhika Jeweltec at -25.20%. Asian Star Co. has a 1-year return of -19.79%, which is better than Radhika Jeweltec but worse than T B Z. Additionally, the six-month returns are negative for Motisons Jewel, PNGS Gargi FJ, and Radhika Jeweltec.

View full answer

How big is Asian Star Co.?

14-Aug-2026

As of 14th August, Asian Star Company Ltd has a market capitalization of 961.00 Cr, with recent Net Sales of 2803.77 Cr and a Net Profit of 33.13 Cr.

As of 14th August, Asian Star Company Ltd has a market capitalization of 961.00 Cr, categorized as a Micro Cap.<BR><BR>In the latest four quarters, the company reported Net Sales of 2803.77 Cr and a Net Profit of 33.13 Cr.<BR><BR>The latest annual period for the balance sheet is March 2025, with Shareholder's Funds amounting to 1,562.05 Cr and Total Assets of 2,407.66 Cr.

View full answer

When is the next results date for Asian Star Company Ltd?

07-Aug-2026

The next results date for Asian Star Company Ltd is 13 August 2026.

The next results date for Asian Star Company Ltd is scheduled for 13 August 2026.

View full answer

Are Asian Star Company Ltd latest results good or bad?

26-May-2026

Asian Star Company Ltd's latest Q4 FY25 results are concerning, showing a net loss of ₹0.41 crore and a 91.07% decline in profit year-on-year. Despite a slight sequential revenue improvement, the company faces significant operational challenges and declining margins, indicating a difficult market environment.

Asian Star Company Ltd's latest results for Q4 FY25 indicate a challenging situation for the company. The net profit for the quarter was a loss of ₹0.41 crore, reflecting a significant decline of 91.07% year-on-year. This marks the second consecutive quarter of losses, raising concerns about the company's ongoing profitability.<BR><BR>Revenue for the quarter stood at ₹745.97 crore, which, while showing a sequential improvement of 13.01% from the previous quarter, represents a troubling 12.68% decline compared to the same quarter last year. The operating margin has also come under severe pressure, dropping to just 0.75%, down from 3.03% in the previous quarter and 0.54% a year ago.<BR><BR>The company's financial performance highlights fundamental challenges in cost management and operational efficiency, as indicated by rising employee costs and an elevated interest burden. Overall, the results suggest that Asian Star is struggling to navigate a difficult market environment, particularly within the gems and jewellery sector, which is facing broader industry headwinds.<BR><BR>In summary, the latest results can be characterized as bad, reflecting ongoing operational difficulties and a lack of profitability.

View full answer

Is Asian Star Co. technically bullish or bearish?

05-Dec-2025

As of December 4, 2025, Asian Star Co. exhibits a mildly bearish trend, influenced by bearish signals from MACD, Bollinger Bands, and moving averages, with weak momentum indicated by the RSI.

As of 4 December 2025, the technical trend has changed from bearish to mildly bearish. The current stance is mildly bearish, primarily driven by the bearish signals from the MACD and Bollinger Bands on both weekly and monthly time frames. The daily moving averages also indicate a bearish trend. The KST is bearish on both weekly and monthly charts, while Dow Theory shows a mildly bearish stance on the weekly but no trend on the monthly. The RSI shows no signal in both time frames, indicating a lack of momentum. Overall, the indicators suggest a weak bearish sentiment in the market for Asian Star Co.

View full answer

How has been the historical performance of Asian Star Co.?

27-Nov-2025

Asian Star Co. has experienced a declining trend in net sales and profits, with net sales dropping from 4,478.25 Cr in March 2023 to 2,955.75 Cr in March 2025, and profit after tax decreasing from 77.58 Cr to 41.50 Cr in the same period, despite a recovery in cash flow from operating activities.

Answer:<BR>The historical performance of Asian Star Co. shows a declining trend in net sales and profits over the past few years, with a notable drop in the most recent fiscal year ending March 2025.<BR><BR>Breakdown:<BR>Asian Star Co. reported net sales of 2,955.75 Cr in March 2025, a significant decrease from 3,523.30 Cr in March 2024 and 4,478.25 Cr in March 2023. Total operating income followed a similar trend, declining to 2,955.75 Cr in March 2025 from 3,523.30 Cr in the previous year. The company's total expenditure also decreased to 2,874.84 Cr in March 2025, down from 3,405.45 Cr in March 2024. Operating profit, excluding other income, was 80.91 Cr in March 2025, down from 117.85 Cr in March 2024, while profit before tax fell to 54.13 Cr from 97.11 Cr. Consequently, profit after tax decreased to 41.50 Cr in March 2025 from 77.58 Cr in March 2024. The earnings per share (EPS) also reflected this decline, dropping to 26.98 in March 2025 from 48.24 in March 2024. On the balance sheet, total assets decreased to 2,407.66 Cr in March 2025 from 2,712.65 Cr in March 2024, while total liabilities also fell to 2,407.66 Cr from 2,712.65 Cr. Cash flow from operating activities showed a recovery to 230.00 Cr in March 2025, compared to a negative cash flow of -65.00 Cr in March 2024, indicating some operational improvement despite the overall decline in sales and profits.

View full answer

Is Asian Star Co. overvalued or undervalued?

09-Jun-2025

As of June 2, 2025, Asian Star Co. is fairly valued with a PE ratio of 25.08, lower than Titan Company's 94.61 and more attractive than Kalyan Jewellers' 81.3, while recently outperforming the Sensex with returns of 3.57% and 11.03% over the past week and month, respectively.

As of 2 June 2025, the valuation grade for Asian Star Co. has moved from very attractive to attractive. The company appears to be fairly valued based on its current metrics. Key ratios include a PE ratio of 25.08, an EV to EBITDA of 15.92, and a Price to Book Value of 0.73. <BR><BR>In comparison to its peers, Asian Star Co. has a lower PE ratio than Titan Company, which stands at 94.61, and is more attractive than Kalyan Jewellers, which is considered expensive at a PE of 81.3. Despite its recent stock performance lagging behind the Sensex over the longer term, Asian Star Co. has outperformed the index in the past week and month, with returns of 3.57% and 11.03%, respectively. Overall, the company is fairly valued within its industry context.

View full answer

Who are the top shareholders of the Asian Star Co.?

06-Jun-2025

The top shareholder of Asian Star Co. is Vipul Prabodh Shah, who holds 24.99% of the shares. The highest public shareholder is Flora Impex Private Limited with 4.9%, while individual investors own 0.3%.

The top shareholders of Asian Star Co. include the promoters, with Vipul Prabodh Shah holding the highest stake at 24.99%. There are no pledged promoter holdings, and mutual funds and foreign institutional investors do not hold any shares in the company. The highest public shareholder is Flora Impex Private Limited, which owns 4.9% of the shares. Additionally, individual investors hold a small portion of 0.3%.

View full answer

What is the bonus history of the Asian Star Co.?

06-Jun-2025

Asian Star Co. announced a 1:2 bonus issue on July 19, 2012, with a record date of July 21, 2012, allowing shareholders to receive one additional share for every two shares held.

Asian Star Co. has a bonus history that includes a 1:2 bonus issue announced on July 19, 2012. The record date for this bonus was July 21, 2012. This means that shareholders received one additional share for every two shares they held as of the record date.

View full answer

Has Asian Star Co. declared dividend?

06-Jun-2025

Yes, Asian Star Company Ltd has declared a 15% dividend, amounting to 1.5 per share, with an ex-date of September 13, 2024. Total returns have varied, showing negative performance in shorter periods and positive returns over the longer term.

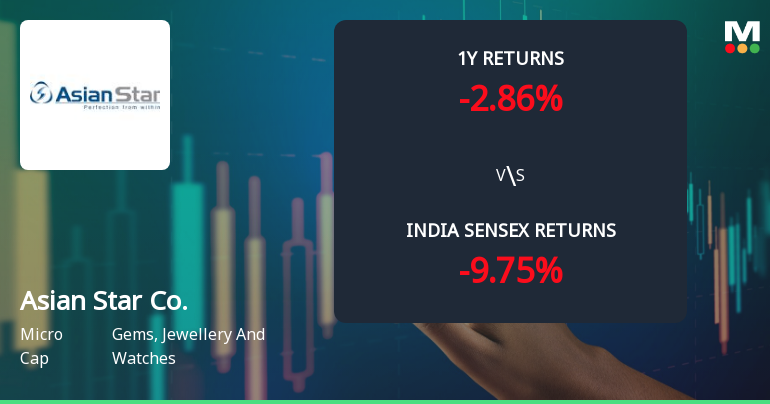
Asian Star Company Ltd has declared a 15% dividend.<BR><BR>Dividend Details:<BR>- Percentage announced: 15%<BR>- Amount per share: 1.5<BR>- Ex-date: 13 Sep 24<BR><BR>Dividend Yield: 0.21%.<BR><BR>Total Returns by Period:<BR>In the 6-month period, the price return was -7.72%, the dividend return was 0%, resulting in a total return of -7.72%.<BR><BR>For the 1-year period, the price return was -1.98%, the dividend return was 0.19%, leading to a total return of -1.79%.<BR><BR>Over the 2-year period, the price return was 12.14%, the dividend return was 0.41%, which resulted in a total return of 12.55%.<BR><BR>In the 3-year period, the price return was -2.95%, the dividend return was 0.61%, culminating in a total return of -2.34%.<BR><BR>During the 4-year period, the price return was -26.55%, the dividend return was 0.64%, resulting in a total return of -25.91%.<BR><BR>For the 5-year period, the price return was 12.29%, the dividend return was 1.09%, leading to a total return of 13.38%.<BR><BR>Overall, Asian Star Company Ltd has declared a dividend, but the total returns over various periods show mixed performance, with negative returns in the shorter terms and some positive returns over the longer term.

View full answer
iScoreScore
Click here to find our call on this stock
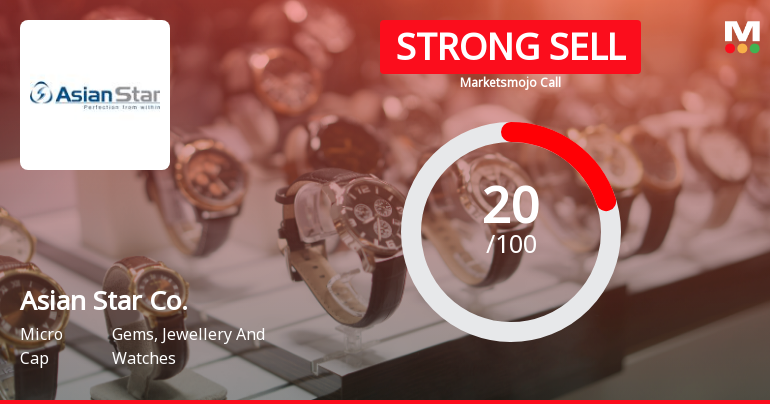
Strong Sell
Sell
Hold
Buy
Strong Buy

Dashboard

1

Weak Long Term Fundamental Strength with an average Return on Equity (ROE) of 4.68%

  • Poor long term growth as Net Sales has grown by an annual rate of 2.52% and Operating profit at 2.14% over the last 5 years
2

Negative results in Jun 26

3

Despite the size of the company, domestic mutual funds hold only 0% of the company

4

Consistent Underperformance against the benchmark over the last 3 years

stock-summaryMojo Parameters

Mojo Parameters

Loading Valuation Snapshot...

Stock DNA

stock-summary
Industry

Gems, Jewellery And Watches

stock-summary
Market cap

INR 961 Cr (Micro Cap)

stock-summary
P/E

29.00

stock-summary
Industry P/E

52

stock-summary
Dividend Yield

0.25%

stock-summary
Debt Equity

0.05

stock-summary
Return on Equity

2.44%

stock-summary
Price to Book

0.58

Revenue and Profits:
Net Sales:
638 Cr
(Quarterly Results - Jun 2026)
Net Profit:
12 Cr
stock-summaryTotal Returns
Total Returns (Price + Dividend) stock-summary
Dividend Yield (0.25%)
TimePeriod
Price Return
Dividend Return
Total Return
3 Months
-16.13%
0%
-16.13%
6 Months
-11.4%
0%
-11.4%
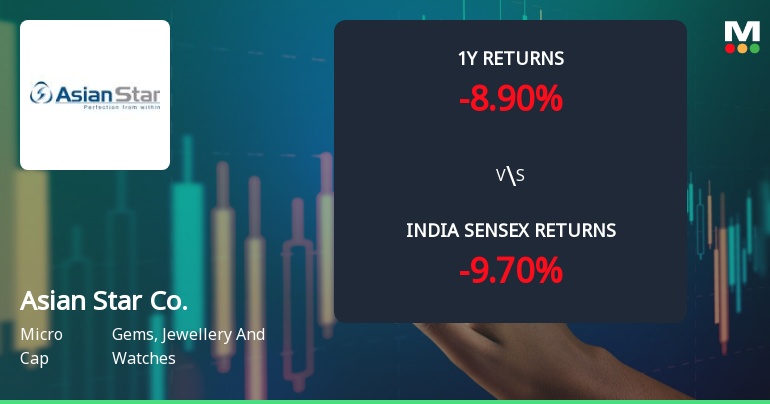
1 Year
-19.61%
0.20%
-19.41%
2 Years
-27.07%
0.34%
-26.73%
3 Years
-21.0%
0.58%
-20.42%
4 Years
-22.72%
0.80%
-21.92%
5 Years
-33.47%
0.83%
-32.64%

Latest dividend: 1.5 per share ex-dividend date: Sep-22-2025

Risk Adjusted Returns v/s stock-summary
Returns Beta
Icon
Beta has not been calculated since enough price history is not available
stock-summaryNews & Corporate Actions

Announcements stock-summary

Announcement under Regulation 30 (LODR)-Newspaper Publication

14-Aug-2026 | Source : BSE

Newspaper advertisement pertaining to Financial result for the quarter ended June 30 2026

Results - Financials Result As On June 30 2026

13-Aug-2026 | Source : BSE

1. Approved the UFR for the quarter ended June 30 2026

Board Meeting Outcome for Outcome Of Board Meeting Of The Company

13-Aug-2026 | Source : BSE

1. Approved the Un-Audited Financial Results (Standalone & Consolidated) along with Limited Review Report (Standalone & Consolidated) of the Company for the quarter ended June 30 2026 prepared in accordance with Ind AS.

Corporate Actions stock-summary

stock-summary
BOARD MEETING

No Upcoming Board Meetings

stock-summary
DIVIDEND

Asian Star Company Ltd has declared 15% dividend, ex-date: 22 Sep 25

stock-summary
SPLITS

No Splits history available

stock-summary
BONUS

Asian Star Company Ltd has announced 1:2 bonus issue, ex-date: 19 Jul 12

stock-summary
RIGHTS

No Rights history available

stock-summaryKey Factors

Quality key factors stock-summary

Factor
Value
Sales Growth (5y)
-2.89%
EBIT Growth (5y)
-9.05%
EBIT to Interest (avg)
6.48
Debt to EBITDA (avg)
5.81
Net Debt to Equity (avg)
0.05
Sales to Capital Employed (avg)
1.78
Tax Ratio
19.82%
Dividend Payout Ratio
5.56%
Pledged Shares
0
Institutional Holding
4.21%
ROCE (avg)
5.77%
ROE (avg)
4.68%

Valuation key factors

Factor
Value
P/E Ratio
29
Industry P/E
52
Price to Book Value
0.58
EV to EBIT
22.78
EV to EBITDA
18.77
EV to Capital Employed
0.60
EV to Sales
0.37
PEG Ratio
NA
Dividend Yield
0.25%
ROCE (Latest)
3.12%
ROE (Latest)
2.44%

Technicals key factors

Indicator
Weekly
Monthly
MACD
Bearish
Bearish
RSI
No Signal
No Signal
Bollinger Bands
Mildly Bearish
Mildly Bearish
Moving Averages
Bearish (Daily)
KST
Bearish
Bearish
Dow Theory
Mildly Bearish
No Trend
OBV
Mildly Bearish
Bullish
stock-summary Technical Indicator Scale: Bearish, Mildly Bearish, Sideways, Mildly Bullish, Bullish  Turned 
stock-summaryShareholding
Shareholding Snapshot : Jun 2026stock-summary
Shareholding Compare (%holding) stock-summary
Majority shareholders

Promoters

Pledged Promoter Holdings

None

Mutual Funds

Held by 0 Schemes

FIIs

Held by 0 FIIs

Promoter with highest holding

Vipul Prabodh Shah (24.99%)

Highest Public shareholder

Flora Impex Private Limited (4.9%)

Individual Investors Holdings

0.61%

stock-summaryFinancial
[
  {
    "link": "quarterly",
    "btn_text": "All Quarterly Results",
    "header": "Quarterly Results Snapshot (Consolidated) - Jun'26 - YoY",
    "rhs": [
      {
        "prefix": "Net Sales ",
        "suffix": "YoY Growth in quarter ended Jun 2026 is -10.92% vs -5.62% in Jun 2025",
        "dir": -1
      },
      {
        "prefix": "Consolidated Net Profit ",
        "suffix": "YoY Growth in quarter ended Jun 2026 is -37.69% vs 4.71% in Jun 2025",
        "dir": -1
      }
    ],
    "table": {
      "header": [
        "Jun'26",
        "Jun'25",
        "Change(%)"
      ],
      "body": [
        {
          "field": "Net Sales",
          "val1": "638.31",
          "val2": "716.54",
          "chgp": "-10.92%",
          "chgp_class": "negative"
        },
        {
          "field": "Operating Profit (PBDIT) excl Other Income",
          "val1": "13.41",
          "val2": "21.72",
          "chgp": "-38.26%",
          "chgp_class": "negative"
        },
        {
          "field": "Interest",
          "val1": "5.20",
          "val2": "7.31",
          "chgp": "-28.86%",
          "chgp_class": "positive"
        },
        {
          "field": "Exceptional Items",
          "val1": "0.00",
          "val2": "0.00",
          "chgp": "",
          "chgp_class": "neutral"
        },
        {
          "field": "Consolidate Net Profit",
          "val1": "12.05",
          "val2": "19.34",
          "chgp": "-37.69%",
          "chgp_class": "negative"
        },
        {
          "field": "Operating Profit Margin (Excl OI)",
          "val1": "2.10%",
          "val2": "3.03%",
          "chgp": "-0.93%",
          "chgp_class": "negative"
        }
      ]
    }
  },
  {
    "link": "half-yearly",
    "btn_text": "All Half Yearly Results",
    "header": "Half Yearly Results Snapshot (Consolidated) - Sep'25",
    "rhs": [
      {
        "prefix": "Net Sales ",
        "suffix": " Growth in half year ended Sep 2025 is 4.44% vs -23.45% in Sep 2024",
        "dir": 1
      },
      {
        "prefix": "Consolidated Net Profit ",
        "suffix": " Growth in half year ended Sep 2025 is -12.91% vs -12.09% in Sep 2024",
        "dir": -1
      }
    ],
    "table": {
      "header": [
        "Sep'25",
        "Sep'24",
        "Change(%)"
      ],
      "body": [
        {
          "field": "Net Sales",
          "val1": "1,475.95",
          "val2": "1,413.20",
          "chgp": "4.44%",
          "chgp_class": "positive"
        },
        {
          "field": "Operating Profit (PBDIT) excl Other Income",
          "val1": "46.19",
          "val2": "53.67",
          "chgp": "-13.94%",
          "chgp_class": "negative"
        },
        {
          "field": "Interest",
          "val1": "13.96",
          "val2": "19.22",
          "chgp": "-27.37%",
          "chgp_class": "positive"
        },
        {
          "field": "Exceptional Items",
          "val1": "0.00",
          "val2": "-2.57",
          "chgp": "100.00%",
          "chgp_class": "positive"
        },
        {
          "field": "Consolidate Net Profit",
          "val1": "31.04",
          "val2": "35.64",
          "chgp": "-12.91%",
          "chgp_class": "negative"
        },
        {
          "field": "Operating Profit Margin (Excl OI)",
          "val1": "3.13%",
          "val2": "3.80%",
          "chgp": "-0.67%",
          "chgp_class": "negative"
        }
      ]
    }
  },
  {
    "link": "nine-monthly",
    "btn_text": "All Nine Monthly Results",
    "header": "Nine Monthly Results Snapshot (Consolidated) - Dec'25",
    "rhs": [
      {
        "prefix": "Net Sales ",
        "suffix": "YoY Growth in nine months ended Dec 2025 is 1.65% vs -17.17% in Dec 2024",
        "dir": 1
      },
      {
        "prefix": "Consolidated Net Profit ",
        "suffix": "YoY Growth in nine months ended Dec 2025 is -14.37% vs -18.61% in Dec 2024",
        "dir": 1
      }
    ],
    "table": {
      "header": [
        "Dec'25",
        "Dec'24",
        "Change(%)"
      ],
      "body": [
        {
          "field": "Net Sales",
          "val1": "2,136.04",
          "val2": "2,101.45",
          "chgp": "1.65%",
          "chgp_class": "positive"
        },
        {
          "field": "Operating Profit (PBDIT) excl Other Income",
          "val1": "58.26",
          "val2": "76.30",
          "chgp": "-23.64%",
          "chgp_class": "negative"
        },
        {
          "field": "Interest",
          "val1": "19.39",
          "val2": "26.76",
          "chgp": "-27.54%",
          "chgp_class": "positive"
        },
        {
          "field": "Exceptional Items",
          "val1": "0.00",
          "val2": "-2.57",
          "chgp": "100.00%",
          "chgp_class": "positive"
        },
        {
          "field": "Consolidate Net Profit",
          "val1": "40.82",
          "val2": "47.67",
          "chgp": "-14.37%",
          "chgp_class": "negative"
        },
        {
          "field": "Operating Profit Margin (Excl OI)",
          "val1": "2.73%",
          "val2": "3.63%",
          "chgp": "-0.90%",
          "chgp_class": "negative"
        }
      ]
    }
  },
  {
    "link": "annual",
    "btn_text": "All Annual Results",
    "header": "Annual Results Snapshot (Consolidated) - Mar'26",
    "rhs": [
      {
        "prefix": "Net Sales ",
        "suffix": "YoY Growth in year ended Mar 2026 is -2.49% vs -16.11% in Mar 2025",
        "dir": 1
      },
      {
        "prefix": "Consolidated Net Profit ",
        "suffix": "YoY Growth in year ended Mar 2026 is -6.41% vs -44.08% in Mar 2025",
        "dir": 1
      }
    ],
    "table": {
      "header": [
        "Mar'26",
        "Mar'25",
        "Change(%)"
      ],
      "body": [
        {
          "field": "Net Sales",
          "val1": "2,882.01",
          "val2": "2,955.75",
          "chgp": "-2.49%",
          "chgp_class": "negative"
        },
        {
          "field": "Operating Profit (PBDIT) excl Other Income",
          "val1": "63.82",
          "val2": "80.91",
          "chgp": "-21.12%",
          "chgp_class": "negative"
        },
        {
          "field": "Interest",
          "val1": "25.56",
          "val2": "33.68",
          "chgp": "-24.11%",
          "chgp_class": "positive"
        },
        {
          "field": "Exceptional Items",
          "val1": "0.00",
          "val2": "-2.57",
          "chgp": "100.00%",
          "chgp_class": "positive"
        },
        {
          "field": "Consolidate Net Profit",
          "val1": "40.42",
          "val2": "43.19",
          "chgp": "-6.41%",
          "chgp_class": "negative"
        },
        {
          "field": "Operating Profit Margin (Excl OI)",
          "val1": "2.21%",
          "val2": "2.74%",
          "chgp": "-0.53%",
          "chgp_class": "negative"
        }
      ]
    }
  }
]

Quarterly Results Snapshot (Consolidated) - Jun'26 - YoYstock-summary

Jun'26
Jun'25
Change(%)
Net Sales
638.31
716.54
-10.92%
Operating Profit (PBDIT) excl Other Income
13.41
21.72
-38.26%
Interest
5.20
7.31
-28.86%
Exceptional Items
0.00
0.00
Consolidate Net Profit
12.05
19.34
-37.69%
Operating Profit Margin (Excl OI)
2.10%
3.03%
-0.93%
Values in Rs Cr.
Direction Arrows
Net Sales

YoY Growth in quarter ended Jun 2026 is -10.92% vs -5.62% in Jun 2025

Direction Arrows
Consolidated Net Profit

YoY Growth in quarter ended Jun 2026 is -37.69% vs 4.71% in Jun 2025

Half Yearly Results Snapshot (Consolidated) - Sep'25stock-summary

Sep'25
Sep'24
Change(%)
Net Sales
1,475.95
1,413.20
4.44%
Operating Profit (PBDIT) excl Other Income
46.19
53.67
-13.94%
Interest
13.96
19.22
-27.37%
Exceptional Items
0.00
-2.57
100.00%
Consolidate Net Profit
31.04
35.64
-12.91%
Operating Profit Margin (Excl OI)
3.13%
3.80%
-0.67%
Values in Rs Cr.
Direction Arrows
Net Sales

Growth in half year ended Sep 2025 is 4.44% vs -23.45% in Sep 2024

Direction Arrows
Consolidated Net Profit

Growth in half year ended Sep 2025 is -12.91% vs -12.09% in Sep 2024

Nine Monthly Results Snapshot (Consolidated) - Dec'25stock-summary

Dec'25
Dec'24
Change(%)
Net Sales
2,136.04
2,101.45
1.65%
Operating Profit (PBDIT) excl Other Income
58.26
76.30
-23.64%
Interest
19.39
26.76
-27.54%
Exceptional Items
0.00
-2.57
100.00%
Consolidate Net Profit
40.82
47.67
-14.37%
Operating Profit Margin (Excl OI)
2.73%
3.63%
-0.90%
Values in Rs Cr.
Direction Arrows
Net Sales

YoY Growth in nine months ended Dec 2025 is 1.65% vs -17.17% in Dec 2024

Direction Arrows
Consolidated Net Profit

YoY Growth in nine months ended Dec 2025 is -14.37% vs -18.61% in Dec 2024

Annual Results Snapshot (Consolidated) - Mar'26stock-summary

Mar'26
Mar'25
Change(%)
Net Sales
2,882.01
2,955.75
-2.49%
Operating Profit (PBDIT) excl Other Income
63.82
80.91
-21.12%
Interest
25.56
33.68
-24.11%
Exceptional Items
0.00
-2.57
100.00%
Consolidate Net Profit
40.42
43.19
-6.41%
Operating Profit Margin (Excl OI)
2.21%
2.74%
-0.53%
Values in Rs Cr.
Direction Arrows
Net Sales

YoY Growth in year ended Mar 2026 is -2.49% vs -16.11% in Mar 2025

Direction Arrows
Consolidated Net Profit

YoY Growth in year ended Mar 2026 is -6.41% vs -44.08% in Mar 2025

stock-summaryCompany CV
About Asian Star Company Ltd stock-summary

stock-summary
Asian Star Company Ltd
Micro Cap
Gems, Jewellery And Watches
Incorporated in Nov.'71 as a partnership firm, Asian Star Company became public limited in Mar.'95. It obtained Certificate of Commencement of business in Mar.'95. The Company is one of the world's leading diamantaires primarily engaged in diamond cutting and polishing, jewellery manufacturing and retailing. The Company is also engaged in generation of electricity through wind power in India.
Company Coordinates stock-summary
Company Details
114-C Mittal Court, Nariman Point Mumbai Maharashtra : 400021
stock-summary
Tel: 91-22-62444111
stock-summary
info@asianstargroup.com
Registrar Details
Bigshare Services Pvt Ltd , E-2 , Ansa Industrial Estate, Saki Vihar Road, Saki Naka, Andheri (E), Mumbai