
Compare Manoj Vaibhav with Similar Stocks
Dashboard
Poor long term growth as Net Sales has grown by an annual rate of 12.98% and Operating profit at 11.30% over the last 5 years
Flat results in Mar 26
Despite the size of the company, domestic mutual funds hold only 0% of the company
Below par performance in long term as well as near term
Stock DNA
Gems, Jewellery And Watches
INR 856 Cr (Micro Cap)
7.00
NA
0.00%
0.51
15.06%
1.09
Total Returns (Price + Dividend) 
Manoj Vaibhav for the last several years.
Risk Adjusted Returns v/s
Returns Beta

News
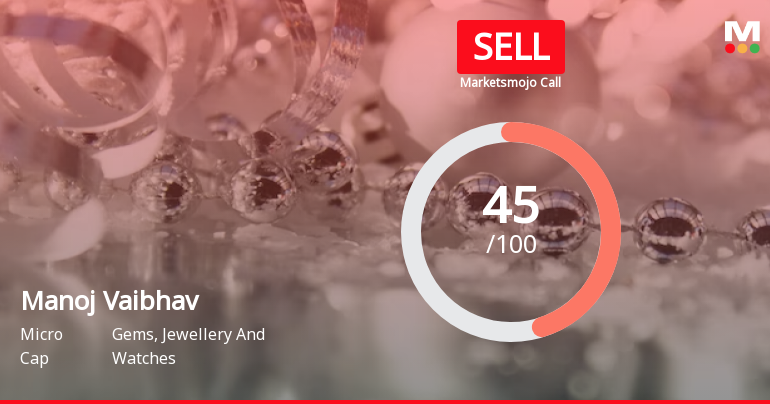
Manoj Vaibhav Gems N Jewellers Ltd is Rated Sell
Manoj Vaibhav Gems N Jewellers Ltd is rated Sell by MarketsMOJO. This rating was last updated on 22 May 2026. However, all fundamentals, returns, and financial metrics discussed below reflect the stock’s current position as of 23 July 2026, providing investors with the latest comprehensive analysis.
Read full news article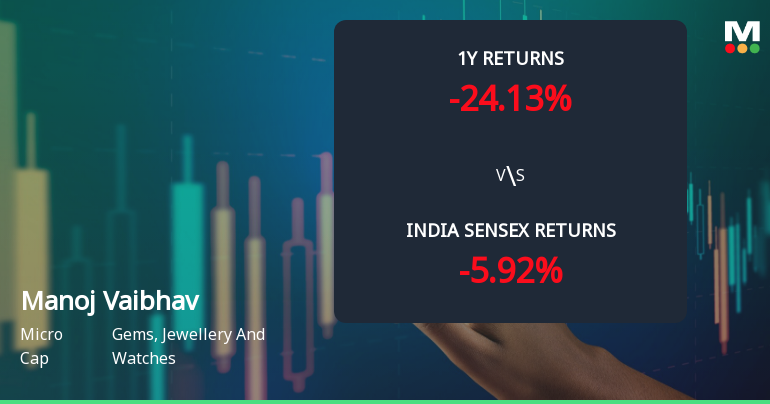
Manoj Vaibhav Gems N Jewellers Ltd Sees Mixed Technical Signals Amid Price Momentum Shift
Manoj Vaibhav Gems N Jewellers Ltd has experienced a notable shift in price momentum, reflected in a complex blend of technical indicator signals. While the stock’s recent 6.12% daily gain to ₹165.55 signals renewed investor interest, underlying technical trends reveal a nuanced picture with both bullish and bearish elements influencing near-term prospects.
Read full news article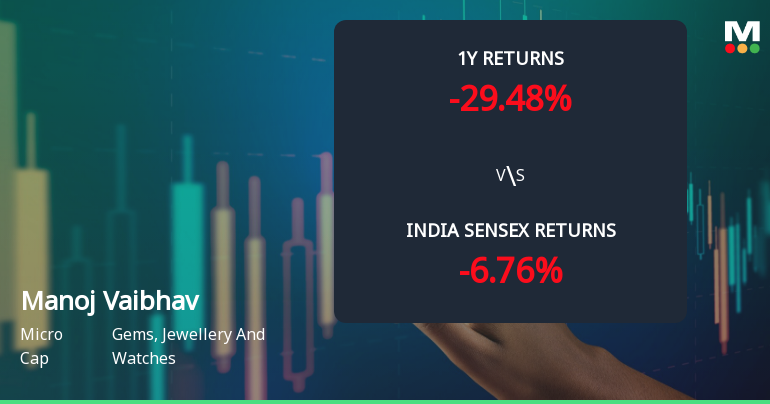
Manoj Vaibhav Gems N Jewellers Ltd Faces Bearish Technical Shift Amid Mixed Momentum
Manoj Vaibhav Gems N Jewellers Ltd has experienced a notable shift in its technical momentum, with key indicators signalling a bearish trend. The company’s micro-cap status and recent downgrade from a Hold to a Sell rating reflect growing concerns among investors, as price action and technical parameters suggest weakening market sentiment.
Read full news article Announcements
Compliances-Certificate under Reg. 74 (5) of SEBI (DP) Regulations 2018
13-Jul-2026 | Source : BSECertificate under Regulation 74(5) of SEBI (DP) Regulations 2018.
Announcement under Regulation 30 (LODR)-Credit Rating
10-Jul-2026 | Source : BSEWe hereby submit the credit rating issued by ICRA.
Closure of Trading Window
27-Jun-2026 | Source : BSEClosure of Trading Window.
Corporate Actions

No Upcoming Board Meetings

No Dividend history available

No Splits history available

No Bonus history available

No Rights history available
Quality key factors
Valuation key factors
Technicals key factors
 Technical Indicator Scale: Bearish, Mildly Bearish, Sideways, Mildly Bullish, Bullish Turned
 Shareholding Snapshot : Jun 2026
Shareholding Compare (%holding)
Promoters
None
Held by 0 Schemes
Held by 3 FIIs (0.64%)
Grandhi Bharata Mallika Ratna Kumari Huf (54.35%)
Collate Dealers Private (1.65%)
17.55%
Quarterly Results Snapshot (Standalone) - Mar'26 - QoQ

QoQ Growth in quarter ended Mar 2026 is 10.17% vs -9.40% in Dec 2025

QoQ Growth in quarter ended Mar 2026 is -18.38% vs 8.73% in Dec 2025
Half Yearly Results Snapshot (Standalone) - Sep'25
Growth in half year ended Sep 2025 is 10.45% vs 4.71% in Sep 2024
Growth in half year ended Sep 2025 is 8.03% vs 16.98% in Sep 2024
Nine Monthly Results Snapshot (Standalone) - Dec'25
YoY Growth in nine months ended Dec 2025 is 18.50% vs 4.72% in Dec 2024
YoY Growth in nine months ended Dec 2025 is 17.83% vs 22.07% in Dec 2024
Annual Results Snapshot (Standalone) - Mar'26
YoY Growth in year ended Mar 2026 is 15.10% vs 10.90% in Mar 2025
YoY Growth in year ended Mar 2026 is 14.49% vs 24.09% in Mar 2025
About Manoj Vaibhav Gems N Jewellers Ltd

Company Coordinates


