
Compare Hatsun Agro with Similar Stocks
Total Returns (Price + Dividend) 
Latest dividend: 9.890174649094611 per share ex-dividend date: May-26-2026
Risk Adjusted Returns v/s
Returns Beta

News
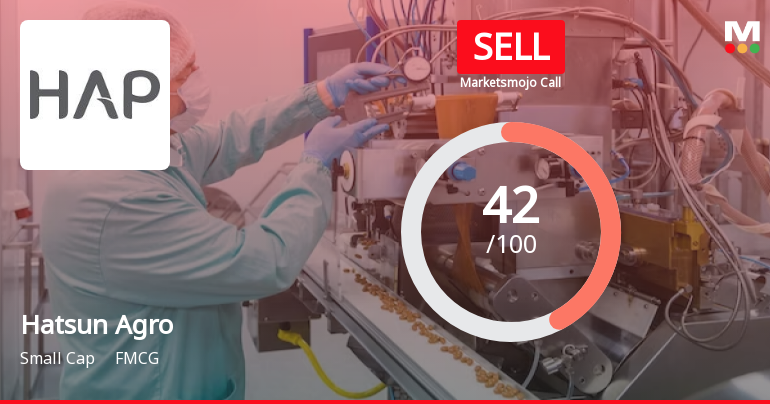
Hatsun Agro Product Ltd is Rated Sell
Hatsun Agro Product Ltd is rated Sell by MarketsMOJO, with this rating last updated on 04 May 2026. However, all fundamentals, returns, and financial metrics discussed here reflect the stock's current position as of 19 June 2026, providing investors with the latest comprehensive analysis.
Read full news article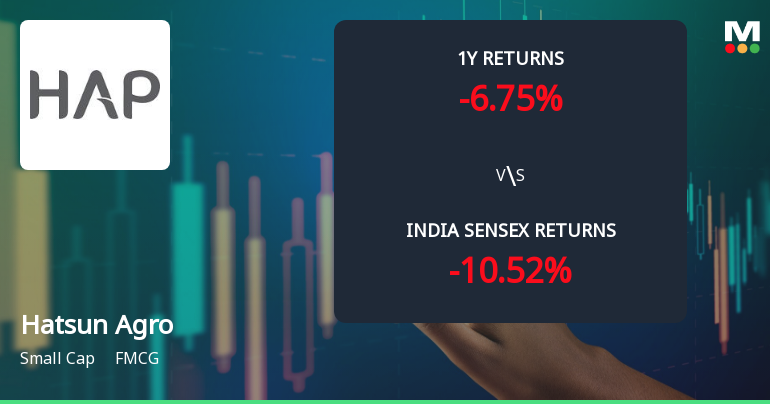
Hatsun Agro Product Ltd Technical Momentum Shifts Amid Mixed Market Signals
Hatsun Agro Product Ltd, a small-cap FMCG player, has experienced a subtle shift in its technical momentum, moving from a bearish to a mildly bearish trend. Despite a modest daily price gain of 0.98%, the stock’s technical indicators present a complex picture, with some signals pointing to cautious optimism while others suggest continued pressure. This article analyses the recent technical parameter changes, key momentum indicators, and the stock’s relative performance against the broader market.
Read full news article
Hatsun Agro Product Ltd Faces Bearish Momentum Amid Technical Downgrade
Hatsun Agro Product Ltd, a small-cap player in the FMCG sector, has experienced a notable shift in its technical momentum, with key indicators signalling a bearish trend. The company’s stock price has declined by 2.55% on 11 Jun 2026, reflecting growing investor caution amid weakening technical signals and a downgrade in its Mojo Grade from Hold to Sell.
Read full news article Announcements
E-Mail Communication To The Members Of Hatsun Agro Product Limited - Deduction Of TDS On 1St Interim Dividend For The Year 2026-27
29-May-2026 | Source : BSEE-mail communication to the members of Hatsun Agro Product Limited - Deduction of TDS on 1st Interim Dividend for the year 2026-27
Announcement under Regulation 30 (LODR)-Newspaper Publication
22-May-2026 | Source : BSENotice to shareholders with regard to transfer of unclaimed dividend and equity shares of the Company to Investor Education and Protection Fund (IEPF) and Special Window for re-lodgment of transfer requests of physical shares - Newspaper advertisements
Compliances-Reg.24(A)-Annual Secretarial Compliance
21-May-2026 | Source : BSEAnnual Secretarial Compliance Report for the financial year 2025-26
Corporate Actions

No Upcoming Board Meetings

Hatsun Agro Product Ltd has declared 1000% dividend, ex-date: 26 May 26

Hatsun Agro Product Ltd has announced 1:2 stock split, ex-date: 03 Oct 11

Hatsun Agro Product Ltd has announced 1:3 bonus issue, ex-date: 09 Dec 20

Hatsun Agro Product Ltd has announced 1:30 rights issue, ex-date: 07 Dec 22
Quality key factors
Valuation key factors
Technicals key factors
 Technical Indicator Scale: Bearish, Mildly Bearish, Sideways, Mildly Bullish, Bullish Turned
 Shareholding Snapshot : Mar 2026
Shareholding Compare (%holding)
Promoters
None
Held by 3 Schemes (9.75%)
Held by 46 FIIs (3.14%)
Chandramogan R G (54.88%)
Sbi Focused Equity Fund- Various Schemes (9.46%)
8.64%
Quarterly Results Snapshot (Standalone) - Mar'26 - YoY

YoY Growth in quarter ended Mar 2026 is 14.93% vs 9.57% in Mar 2025
YoY Growth in quarter ended Mar 2026 is 18.32% vs -17.53% in Mar 2025
Half Yearly Results Snapshot (Consolidated) - Sep'25
Not Applicable: The company has declared_date for only one period
Not Applicable: The company has declared_date for only one period
Nine Monthly Results Snapshot (Consolidated) - Dec'25
Not Applicable: The company has declared_date for only one period
Not Applicable: The company has declared_date for only one period
Annual Results Snapshot (Standalone) - Mar'26
YoY Growth in year ended Mar 2026 is 14.48% vs 8.88% in Mar 2025
YoY Growth in year ended Mar 2026 is 27.76% vs 4.32% in Mar 2025
About Hatsun Agro Product Ltd

Company Coordinates


