
Compare Aeroflex Enter. with Similar Stocks
Dashboard
Strong Long Term Fundamental Strength with an average Return on Equity (ROE) of 17.65%
Healthy long term growth as Operating profit has grown by an annual rate of 41.08%
Positive results in Mar 26
With ROE of 7.9, it has a Fair valuation with a 1.9 Price to Book Value
Despite the size of the company, domestic mutual funds hold only 0% of the company
Market Beating performance in long term as well as near term
Stock DNA
Iron & Steel Products
INR 1,654 Cr (Micro Cap)
24.00
23
0.22%
0.05
7.86%
1.86
Total Returns (Price + Dividend) 
Latest dividend: 0.3 per share ex-dividend date: Sep-09-2025
Risk Adjusted Returns v/s
Returns Beta

News

Aeroflex Enterprises Ltd is Rated Hold by MarketsMOJO
Aeroflex Enterprises Ltd is rated 'Hold' by MarketsMOJO, with this rating last updated on 10 June 2026. However, the analysis and financial metrics discussed here reflect the company’s current position as of 22 June 2026, providing investors with the most up-to-date view of the stock’s fundamentals, returns, and technical outlook.
Read full news article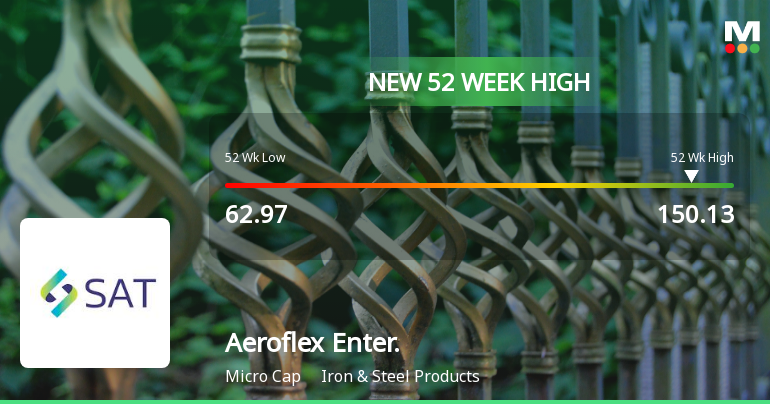
Broad-Based Technical Strength Lifts Aeroflex Enterprises Ltd to 52-Week High of Rs 150.13
Surging past Rs 150.13 on 22 Jun 2026, Aeroflex Enterprises Ltd has marked a significant milestone by reaching a fresh 52-week high. This rally is underpinned by a confluence of bullish technical indicators and sustained price momentum, setting the stage for a compelling momentum narrative in the iron and steel products sector.
Read full news article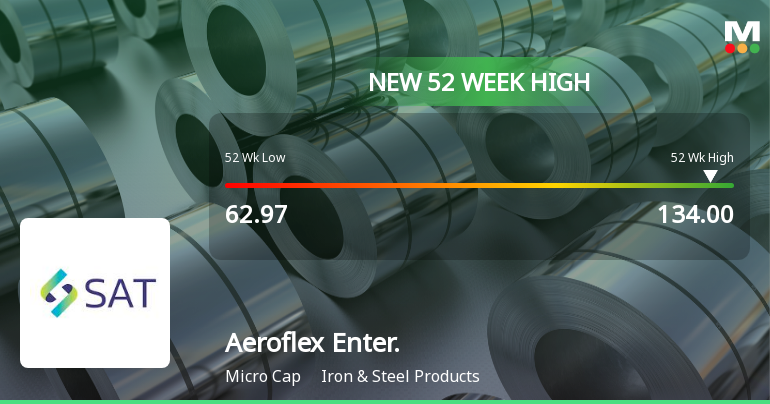
Broad-Based Technical Strength Lifts Aeroflex Enterprises Ltd to 52-Week High of Rs 134
Surging to an intraday peak of Rs 134 on 19 Jun 2026, Aeroflex Enterprises Ltd has marked a significant milestone by reaching a fresh 52-week high. This achievement caps a three-day rally that has delivered a 22.3% return, underscoring the stock's robust momentum amid a broadly subdued market backdrop.
Read full news article Announcements
Disclosures under Reg. 29(2) of SEBI (SAST) Regulations 2011
19-Jun-2026 | Source : BSEThe Exchange has received the disclosure under Regulation 29(2) of SEBI (Substantial Acquisition of Shares & Takeovers) Regulations 2011 for A Flex Invest Pvt Ltd
Disclosures under Reg. 29(2) of SEBI (SAST) Regulations 2011
19-Jun-2026 | Source : BSEThe Exchange has received the disclosure under Regulation 29(2) of SEBI (Substantial Acquisition of Shares & Takeovers) Regulations 2011 for A Flex Invest Pvt Ltd
Disclosures under Reg. 29(2) of SEBI (SAST) Regulations 2011
17-Jun-2026 | Source : BSEThe Exchange has received the disclosure under Regulation 29(2) of SEBI (Substantial Acquisition of Shares & Takeovers) Regulations 2011 for A Flex Invest Pvt Ltd
Corporate Actions

No Upcoming Board Meetings

Aeroflex Enterprises Ltd has declared 15% dividend, ex-date: 09 Sep 25

No Splits history available

No Bonus history available

No Rights history available
Quality key factors
Valuation key factors
Technicals key factors
 Technical Indicator Scale: Bearish, Mildly Bearish, Sideways, Mildly Bullish, Bullish Turned
 Shareholding Snapshot : Mar 2026
Shareholding Compare (%holding)
Promoters
None
Held by 0 Schemes
Held by 4 FIIs (0.54%)
Sat Invest Private Limited (44.95%)
Space Age Polymers Llp (4.51%)
28.04%
Quarterly Results Snapshot (Consolidated) - Mar'26 - QoQ

QoQ Growth in quarter ended Mar 2026 is 4.26% vs 11.06% in Dec 2025

QoQ Growth in quarter ended Mar 2026 is 49.81% vs 14.82% in Dec 2025
Half Yearly Results Snapshot (Consolidated) - Sep'25
Growth in half year ended Sep 2025 is 17.83% vs -2.45% in Sep 2024
Growth in half year ended Sep 2025 is -13.75% vs -88.33% in Sep 2024
Nine Monthly Results Snapshot (Consolidated) - Dec'25
YoY Growth in nine months ended Dec 2025 is 19.28% vs 8.44% in Dec 2024
YoY Growth in nine months ended Dec 2025 is -4.33% vs -83.33% in Dec 2024
Annual Results Snapshot (Consolidated) - Mar'26
YoY Growth in year ended Mar 2026 is 20.62% vs 15.56% in Mar 2025
YoY Growth in year ended Mar 2026 is 20.90% vs -79.40% in Mar 2025
About Aeroflex Enterprises Ltd

Company Coordinates


