
Compare Aeroflex Enter. with Similar Stocks
Dashboard
Strong Long Term Fundamental Strength with an average Return on Equity (ROE) of 17.65%
Healthy long term growth as Operating profit has grown by an annual rate of 41.08%
Positive results in Mar 26
With ROE of 7.9, it has a Fair valuation with a 1.9 Price to Book Value
Despite the size of the company, domestic mutual funds hold only 0% of the company
Market Beating performance in long term as well as near term
Stock DNA
Iron & Steel Products
INR 1,479 Cr (Micro Cap)
24.00
23
0.24%
0.05
7.86%
1.71
Total Returns (Price + Dividend) 
Latest dividend: 0.3 per share ex-dividend date: Sep-09-2025
Risk Adjusted Returns v/s
Returns Beta

News
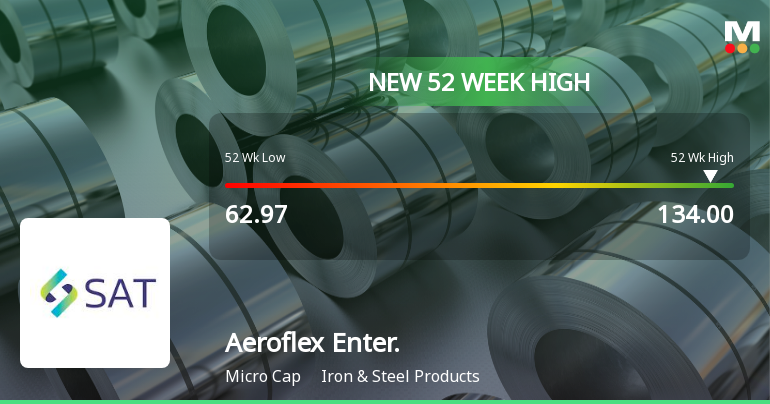
Broad-Based Technical Strength Lifts Aeroflex Enterprises Ltd to 52-Week High of Rs 134
Surging to an intraday peak of Rs 134 on 19 Jun 2026, Aeroflex Enterprises Ltd has marked a significant milestone by reaching a fresh 52-week high. This achievement caps a three-day rally that has delivered a 22.3% return, underscoring the stock's robust momentum amid a broadly subdued market backdrop.
Read full news article
Broad-Based Technical Strength Lifts Aeroflex Enterprises Ltd to 52-Week High of Rs 125.1
From a 52-week low of Rs 62.97 to a fresh high of Rs 125.1 on 18 Jun 2026, Aeroflex Enterprises Ltd has delivered a remarkable 43.29% return over the past year, significantly outperforming the Sensex which declined by 5.34% in the same period. This milestone reflects a powerful rally fuelled by a confluence of bullish technical indicators and sustained price momentum.
Read full news article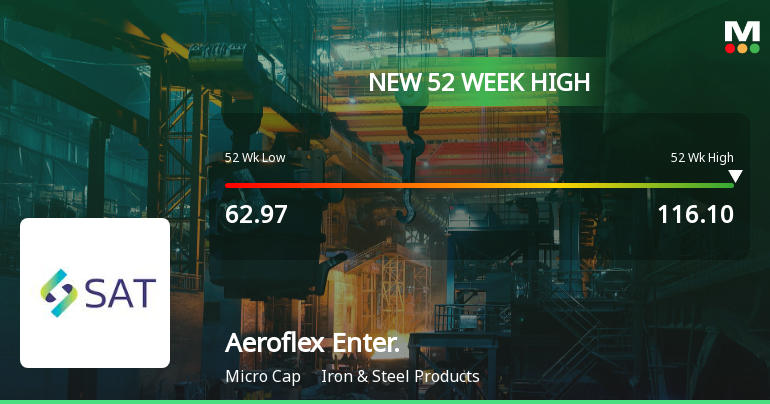
Broad-Based Technical Strength Lifts Aeroflex Enterprises Ltd to 52-Week High of Rs 116.1
Surging past its previous peak, Aeroflex Enterprises Ltd touched a new 52-week high of Rs 116.1 on 17 Jun 2026, marking a 27.99% gain over the past year against the Sensex’s decline of 5.43%. This milestone reflects a sustained upward momentum supported by a confluence of technical indicators and robust price action.
Read full news article Announcements
Disclosures under Reg. 29(2) of SEBI (SAST) Regulations 2011
19-Jun-2026 | Source : BSEThe Exchange has received the disclosure under Regulation 29(2) of SEBI (Substantial Acquisition of Shares & Takeovers) Regulations 2011 for A Flex Invest Pvt Ltd
Disclosures under Reg. 29(2) of SEBI (SAST) Regulations 2011
19-Jun-2026 | Source : BSEThe Exchange has received the disclosure under Regulation 29(2) of SEBI (Substantial Acquisition of Shares & Takeovers) Regulations 2011 for A Flex Invest Pvt Ltd
Disclosures under Reg. 29(2) of SEBI (SAST) Regulations 2011
17-Jun-2026 | Source : BSEThe Exchange has received the disclosure under Regulation 29(2) of SEBI (Substantial Acquisition of Shares & Takeovers) Regulations 2011 for A Flex Invest Pvt Ltd
Corporate Actions

No Upcoming Board Meetings

Aeroflex Enterprises Ltd has declared 15% dividend, ex-date: 09 Sep 25

No Splits history available

No Bonus history available

No Rights history available
Quality key factors
Valuation key factors
Technicals key factors
 Technical Indicator Scale: Bearish, Mildly Bearish, Sideways, Mildly Bullish, Bullish Turned
 Shareholding Snapshot : Mar 2026
Shareholding Compare (%holding)
Promoters
None
Held by 0 Schemes
Held by 4 FIIs (0.54%)
Sat Invest Private Limited (44.95%)
Space Age Polymers Llp (4.51%)
28.04%
Quarterly Results Snapshot (Consolidated) - Mar'26 - QoQ

QoQ Growth in quarter ended Mar 2026 is 4.26% vs 11.06% in Dec 2025

QoQ Growth in quarter ended Mar 2026 is 49.81% vs 14.82% in Dec 2025
Half Yearly Results Snapshot (Consolidated) - Sep'25
Growth in half year ended Sep 2025 is 17.83% vs -2.45% in Sep 2024
Growth in half year ended Sep 2025 is -13.75% vs -88.33% in Sep 2024
Nine Monthly Results Snapshot (Consolidated) - Dec'25
YoY Growth in nine months ended Dec 2025 is 19.28% vs 8.44% in Dec 2024
YoY Growth in nine months ended Dec 2025 is -4.33% vs -83.33% in Dec 2024
Annual Results Snapshot (Consolidated) - Mar'26
YoY Growth in year ended Mar 2026 is 20.62% vs 15.56% in Mar 2025
YoY Growth in year ended Mar 2026 is 20.90% vs -79.40% in Mar 2025
About Aeroflex Enterprises Ltd

Company Coordinates


