
Compare Ratnaveer Precis with Similar Stocks
Dashboard
Healthy long term growth as Net Sales has grown by an annual rate of 30.60%
- INTEREST(Latest six months) At Rs 13.20 cr has Grown at 81.07%
- OPERATING PROFIT TO INTEREST(Q) Lowest at 3.52 times
- ROCE(HY) Lowest at 9.61%
With ROE of 9.6, it has a Attractive valuation with a 1.9 Price to Book Value
Rising Promoter Confidence
Market Beating Performance
Stock DNA
Iron & Steel Products
INR 1,262 Cr (Micro Cap)
20.00
26
0.00%
0.10
9.61%
1.88
Total Returns (Price + Dividend) 
Ratnaveer Precis for the last several years.
Risk Adjusted Returns v/s
Returns Beta

News

Ratnaveer Precision Engineering Ltd Shows Bullish Momentum Amid Technical Upgrades
Ratnaveer Precision Engineering Ltd, a micro-cap player in the Iron & Steel Products sector, has witnessed a notable shift in its technical momentum, upgrading from a mildly bullish to a bullish stance. This change is underpinned by a series of mixed but increasingly positive technical indicators, signalling potential opportunities for investors amid a challenging market backdrop.
Read full news article
Ratnaveer Precision Engineering Ltd is Rated Hold
Ratnaveer Precision Engineering Ltd is rated 'Hold' by MarketsMOJO, with this rating last updated on 28 April 2026. While the rating was revised on that date, the analysis and financial metrics presented here reflect the stock’s current position as of 15 July 2026, providing investors with an up-to-date view of the company’s fundamentals, returns, and market performance.
Read full news article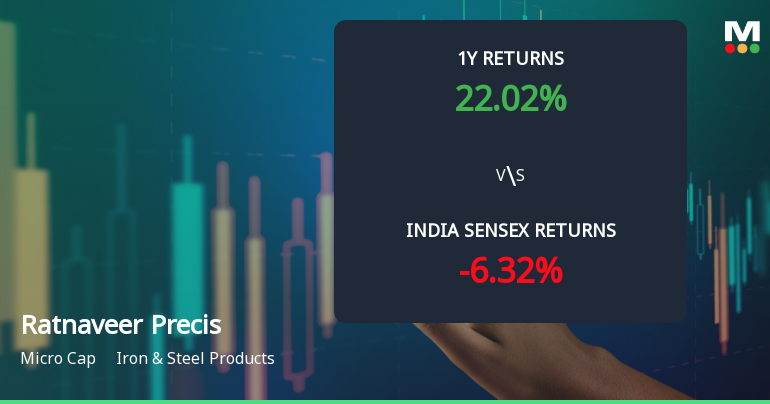
Ratnaveer Precision Engineering Ltd Technical Momentum Shifts Amid Mixed Signals
Ratnaveer Precision Engineering Ltd, a micro-cap player in the Iron & Steel Products sector, has experienced a nuanced shift in its technical momentum, moving from a bullish to a mildly bullish stance. Despite a modest decline in the latest session, the stock’s technical indicators reveal a complex interplay of bullish and bearish signals, prompting a reassessment of its near-term outlook.
Read full news article Announcements
Announcement under Regulation 30 (LODR)-Newspaper Publication
10-Jul-2026 | Source : BSEIntimation of News Paper Publication regarding dispatch of Notice of Postal ballot
Shareholder Meeting / Postal Ballot-Notice of Postal Ballot
09-Jul-2026 | Source : BSEIntimation of Postal Ballot Notice under Regulation 30 of the SEBI (Listing Obligations and Disclosure Requirements) Regulations 2015.
Compliances-Certificate under Reg. 74 (5) of SEBI (DP) Regulations 2018
07-Jul-2026 | Source : BSEConfirmation Certificate under Regulation 74(5) of the SEBI (Depositories and Participants) Regulations 2018 for the first quarter ended 30th June 2026.
Corporate Actions

No Upcoming Board Meetings

No Dividend history available

No Splits history available

No Bonus history available

No Rights history available
Quality key factors
Valuation key factors
Technicals key factors
 Technical Indicator Scale: Bearish, Mildly Bearish, Sideways, Mildly Bullish, Bullish Turned
 Shareholding Snapshot : May 2026
Shareholding Compare (%holding)
Promoters
None
Held by 0 Schemes
Held by 6 FIIs (6.93%)
Vijay Ramanlal Sanghavi (42.89%)
Chungath Karunakaran Padma Kumar (3.77%)
35.87%
Quarterly Results Snapshot (Standalone) - Mar'26 - QoQ

QoQ Growth in quarter ended Mar 2026 is -7.55% vs -5.80% in Dec 2025
QoQ Growth in quarter ended Mar 2026 is 0.83% vs 9.46% in Dec 2025
Half Yearly Results Snapshot (Standalone) - Sep'25
Growth in half year ended Sep 2025 is 26.78% vs 66.91% in Sep 2024
Growth in half year ended Sep 2025 is 22.55% vs 53.12% in Sep 2024
Nine Monthly Results Snapshot (Standalone) - Dec'25
YoY Growth in nine months ended Dec 2025 is 19.02% vs 51.93% in Dec 2024
YoY Growth in nine months ended Dec 2025 is 30.94% vs 41.85% in Dec 2024
Annual Results Snapshot (Standalone) - Mar'26
YoY Growth in year ended Mar 2026 is 19.83% vs 49.80% in Mar 2025
YoY Growth in year ended Mar 2026 is 37.36% vs 50.79% in Mar 2025
About Ratnaveer Precision Engineering Ltd

Company Coordinates


