
Compare Visa Steel with Similar Stocks
Dashboard
With a Negative Book Value, the company has a Weak Long Term Fundamental Strength
- Poor long term growth as Net Sales has grown by an annual rate of -8.04% and Operating profit at 0% over the last 5 years
- The company has a negative book value of Rs 1,376.82 crore
Negative results in Dec 25
Risky - Negative Operating Profits
59.6% of Promoter Shares are Pledged
Stock DNA
Ferrous Metals
INR 632 Cr (Micro Cap)
NA (Loss Making)
29
0.00%
-1.01
3.24%
-0.46
Total Returns (Price + Dividend) 
Latest dividend: 0.9500 per share ex-dividend date: Jul-14-2011
Risk Adjusted Returns v/s
Returns Beta

News
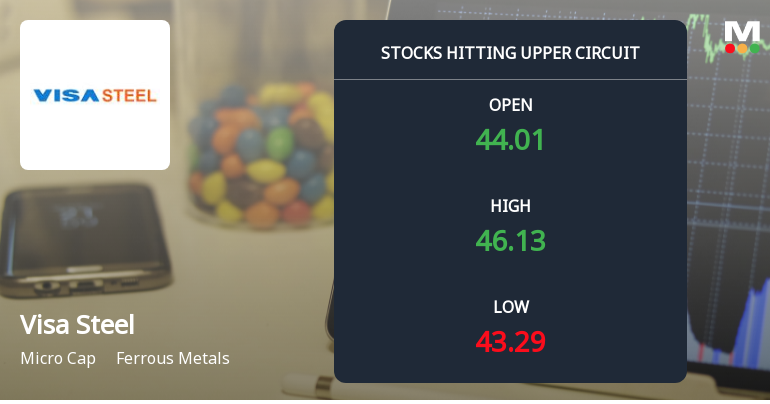
Visa Steel Ltd Locks at Upper Circuit With 4.99% Gain — Buyers Queue, Sellers Absent
At Rs 45.86, the buying was done — not because demand dried up, but because the exchange wouldn't let the stock go any higher. Visa Steel Ltd locked at its upper circuit of 4.99% on 6 May 2026, with buyers queuing and no sellers willing to part with shares.
Read full news article
Visa Steel Ltd Technical Momentum Shifts Amid Mixed Indicator Signals
Visa Steel Ltd has exhibited a notable shift in its technical momentum, moving from a mildly bearish stance to a sideways trend, reflecting a complex interplay of bullish and bearish signals across key technical indicators. Despite a recent 3.17% intraday gain, the stock remains under pressure with a strong sell rating, underscoring the challenges faced by this micro-cap player in the ferrous metals sector.
Read full news article
Visa Steel Ltd Locks at Upper Circuit With 5% Gain — Buyers Queue, Sellers Absent
At Rs 44.64, the buying was done — not because demand dried up, but because the exchange wouldn't let the stock go any higher. Visa Steel Ltd locked at its upper circuit of 4.99% on 5 May 2026, with buyers queuing and no sellers willing to part with shares.
Read full news article Announcements
Disclosures under Reg. 29(2) of SEBI (SAST) Regulations 2011
29-Apr-2026 | Source : BSEThe Exchange has received the disclosure under Regulation 29(2) of SEBI (Substantial Acquisition of Shares & Takeovers) Regulations 2011 for Visa International Ltd
Disclosures under Reg. 29(2) of SEBI (SAST) Regulations 2011
29-Apr-2026 | Source : BSEThe Exchange has received the disclosure under Regulation 29(2) of SEBI (Substantial Acquisition of Shares & Takeovers) Regulations 2011 for VISA Infra Ltd
Disclosures under Reg. 31(1) and 31(2) of SEBI (SAST) Regulations 2011.
29-Apr-2026 | Source : BSEThe Exchange has received Disclosure under Regulation 31(1) and 31(2) of SEBI (Substantial Acquisition of Shares & Takeovers) Regulations 2011 on April 28 2026 for Visa Infra Ltd
Corporate Actions

No Upcoming Board Meetings

Visa Steel Ltd has declared 10% dividend, ex-date: 14 Jul 11

No Splits history available

No Bonus history available

No Rights history available
Quality key factors
Valuation key factors
Technicals key factors
 Technical Indicator Scale: Bearish, Mildly Bearish, Sideways, Mildly Bullish, Bullish Turned
 Shareholding Snapshot : Mar 2026
Shareholding Compare (%holding)
Promoters
59.5984
Held by 0 Schemes
Held by 2 FIIs (11.95%)
Visa Infrastructure Limited (34.33%)
Visa International Limited (18.4%)
6.25%
Quarterly Results Snapshot (Consolidated) - Dec'25 - QoQ

QoQ Growth in quarter ended Dec 2025 is 94.07% vs -56.31% in Sep 2025
QoQ Growth in quarter ended Dec 2025 is 18.25% vs -568.06% in Sep 2025
Half Yearly Results Snapshot (Consolidated) - Sep'25
Growth in half year ended Sep 2025 is -13.50% vs -32.73% in Sep 2024

Growth in half year ended Sep 2025 is -43.63% vs 71.36% in Sep 2024
Nine Monthly Results Snapshot (Consolidated) - Dec'25
YoY Growth in nine months ended Dec 2025 is -3.05% vs -21.35% in Dec 2024
YoY Growth in nine months ended Dec 2025 is -14.43% vs 55.02% in Dec 2024
Annual Results Snapshot (Consolidated) - Mar'25
YoY Growth in year ended Mar 2025 is -15.48% vs 1.89% in Mar 2024
YoY Growth in year ended Mar 2025 is -618.53% vs -104.33% in Mar 2024
About Visa Steel Ltd

Company Coordinates


