
Compare Mukand with Similar Stocks
Dashboard
With a Operating Losses, the company has a Weak Long Term Fundamental Strength
- Poor long term growth as Net Sales has grown by an annual rate of 12.39% and Operating profit at 17.19% over the last 5 years
- Low ability to service debt as the company has a high Debt to EBITDA ratio of 9.92 times
The company has declared positive results in Mar'2026 after 4 consecutive negative quarters
With ROCE of 3.4, it has a Very Attractive valuation with a 1.1 Enterprise value to Capital Employed
Despite the size of the company, domestic mutual funds hold only 0% of the company
Stock DNA
Ferrous Metals
INR 1,922 Cr (Small Cap)
3.00
14
1.50%
1.09
39.69%
1.26
Total Returns (Price + Dividend) 
Latest dividend: 2 per share ex-dividend date: Jul-25-2025
Risk Adjusted Returns v/s
Returns Beta

News

Mukand Ltd is Rated Hold by MarketsMOJO
Mukand Ltd is rated 'Hold' by MarketsMOJO, with this rating last updated on 15 May 2026. However, the analysis and financial metrics discussed here reflect the company’s current position as of 28 June 2026, providing investors with an up-to-date view of the stock’s fundamentals, valuation, financial trends, and technical outlook.
Read full news article
Mukand Ltd is Rated Hold by MarketsMOJO
Mukand Ltd is rated 'Hold' by MarketsMOJO, with this rating last updated on 15 May 2026. However, the analysis and financial metrics discussed here reflect the stock's current position as of 17 June 2026, providing investors with the most up-to-date view of the company’s fundamentals, valuation, financial trends, and technical outlook.
Read full news article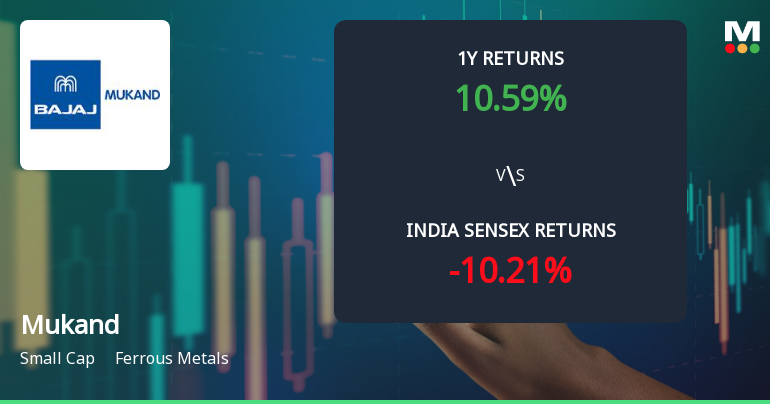
Mukand Ltd Technical Momentum Shifts Amid Mixed Market Signals
Mukand Ltd, a small-cap player in the ferrous metals sector, has experienced a nuanced shift in its technical momentum, moving from a bullish to a mildly bullish stance. Despite a recent dip in price, the stock’s technical indicators present a complex picture, with some signals pointing to sustained strength while others suggest caution. This article analyses the latest technical parameters, price momentum, and comparative returns to provide a comprehensive view for investors.
Read full news article Announcements
Mukand Limited - Reply to Clarification Sought
26-Nov-2019 | Source : NSEMukand Limited with respect to announcement dated 20-Nov-2019, regarding Credit Rating. On basis of above the Company was required to clarify following: 1. In case of downward rating, the disclosure may include reasons published by rating agency for such downward rating. The response of the Company is attached.
Mukand Limited - Clarification
22-Nov-2019 | Source : NSEMukand Limited with respect to announcement dated 20-Nov-2019, regarding Credit Rating. On basis of above the Company is required to clarify following: 1. In case of downward rating, the disclosure may include reasons published by rating agency for such downward rating. The response of the Company is awaited.
Mukand Limited - Credit Rating
21-Nov-2019 | Source : NSEMukand Limited has informed the Exchange regarding Credit Rating
Corporate Actions

No Upcoming Board Meetings

Mukand Ltd has declared 20% dividend, ex-date: 25 Jul 25

No Splits history available

No Bonus history available

Mukand Ltd has announced 1:1 rights issue, ex-date: 10 Feb 14
Quality key factors
Valuation key factors
Technicals key factors
 Technical Indicator Scale: Bearish, Mildly Bearish, Sideways, Mildly Bullish, Bullish Turned
 Shareholding Snapshot : Mar 2026
Shareholding Compare (%holding)
Promoters
None
Held by 5 Schemes (0.0%)
Held by 9 FIIs (0.26%)
Jamnalal Sons Private Limited (19.92%)
Siddhant Commercials Private Limited (2.48%)
15.66%
Quarterly Results Snapshot (Consolidated) - Mar'26 - QoQ

QoQ Growth in quarter ended Mar 2026 is -4.53% vs 14.53% in Dec 2025

QoQ Growth in quarter ended Mar 2026 is 5,309.16% vs 3.85% in Dec 2025
Half Yearly Results Snapshot (Consolidated) - Sep'25
Growth in half year ended Sep 2025 is -9.18% vs -8.63% in Sep 2024
Growth in half year ended Sep 2025 is -21.55% vs -8.57% in Sep 2024
Nine Monthly Results Snapshot (Consolidated) - Dec'25
YoY Growth in nine months ended Dec 2025 is -4.35% vs -3.88% in Dec 2024
YoY Growth in nine months ended Dec 2025 is -23.80% vs -12.34% in Dec 2024
Annual Results Snapshot (Consolidated) - Mar'26
YoY Growth in year ended Mar 2026 is -0.00% vs -5.50% in Mar 2025
YoY Growth in year ended Mar 2026 is 696.09% vs -26.92% in Mar 2025
About Mukand Ltd

Company Coordinates


