
Compare Diana Tea Co with Similar Stocks
Dashboard
With a Operating Losses, the company has a Weak Long Term Fundamental Strength
- Company's ability to service its debt is weak with a poor EBIT to Interest (avg) ratio of 0.43
- The company has been able to generate a Return on Equity (avg) of 2.65% signifying low profitability per unit of shareholders funds
- PAT(Q) At Rs -9.66 cr has Fallen at -1627.3% (vs previous 4Q average)
- NET SALES(Q) Lowest at Rs 7.62 cr
- PBDIT(Q) Lowest at Rs -9.38 cr.
Below par performance in long term as well as near term
Total Returns (Price + Dividend) 
Latest dividend: 0.5025167785234899 per share ex-dividend date: Sep-07-2022
Risk Adjusted Returns v/s
Returns Beta

News

Diana Tea Company Ltd is Rated Strong Sell
Diana Tea Company Ltd is rated Strong Sell by MarketsMOJO, with this rating last updated on 27 May 2026. However, the analysis and financial metrics discussed here reflect the company’s current position as of 01 July 2026, providing investors with the latest insights into its performance and outlook.
Read full news article
Diana Tea Company Ltd is Rated Strong Sell
Diana Tea Company Ltd is rated Strong Sell by MarketsMOJO, with this rating last updated on 27 May 2026. However, the analysis and financial metrics presented here reflect the company’s current position as of 18 June 2026, providing investors with the latest insights into its performance and outlook.
Read full news article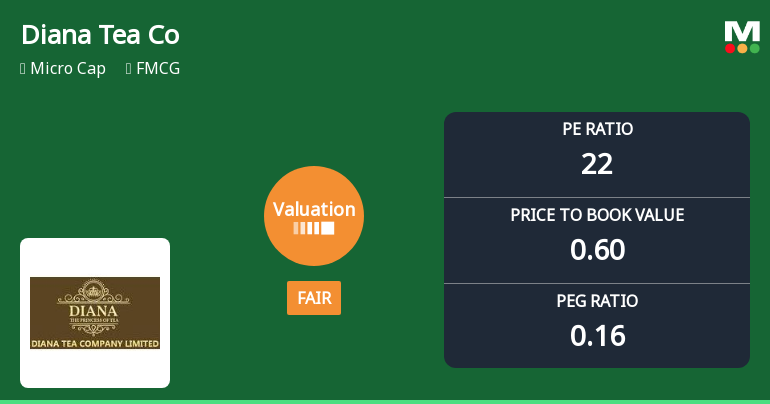
Diana Tea Company Ltd Valuation Shifts Signal Improved Price Attractiveness
Diana Tea Company Ltd has witnessed a notable shift in its valuation parameters, moving from an expensive to a fair valuation grade, reflecting evolving market perceptions amid mixed financial performance and sector dynamics. This article analyses the recent changes in key valuation metrics, compares them with peer averages, and assesses the implications for investors navigating the FMCG micro-cap space.
Read full news article Announcements
Closure of Trading Window
27-Jun-2026 | Source : BSEClosure of Trading Window for the declaration of Unaudited Financial Result of the company for the quarter ended 30th June 2026.
Compliances-Reg.24(A)-Annual Secretarial Compliance
29-May-2026 | Source : BSEAnnual Secretarial Compliance Report for the Financial Year ended 31 March 2026.
Announcement under Regulation 30 (LODR)-Newspaper Publication
29-May-2026 | Source : BSENewspaper Publication of the Financial Result for Quarter and Year ended 31.03.2026.
Corporate Actions

No Upcoming Board Meetings

Diana Tea Company Ltd has declared 10% dividend, ex-date: 07 Sep 22

Diana Tea Company Ltd has announced 5:2 stock split, ex-date: 30 Jul 08

No Bonus history available

No Rights history available
Quality key factors
Valuation key factors
Technicals key factors
 Technical Indicator Scale: Bearish, Mildly Bearish, Sideways, Mildly Bullish, Bullish Turned
 Shareholding Snapshot : Mar 2026
Shareholding Compare (%holding)
Promoters
None
Held by 0 Schemes
Held by 0 FIIs
Diana Capital Limited (54.56%)
Mahendra Girdharilal (1.43%)
33.48%
Quarterly Results Snapshot (Standalone) - Mar'26 - QoQ

QoQ Growth in quarter ended Mar 2026 is -75.47% vs 5.82% in Dec 2025
QoQ Growth in quarter ended Mar 2026 is -282.26% vs 18.83% in Dec 2025
Half Yearly Results Snapshot (Standalone) - Sep'25

Growth in half year ended Sep 2025 is 35.40% vs -11.99% in Sep 2024
Growth in half year ended Sep 2025 is 90.06% vs -60.49% in Sep 2024
Nine Monthly Results Snapshot (Standalone) - Dec'25
YoY Growth in nine months ended Dec 2025 is 31.30% vs -7.38% in Dec 2024
YoY Growth in nine months ended Dec 2025 is 164.97% vs -49.11% in Dec 2024
Annual Results Snapshot (Standalone) - Mar'26
YoY Growth in year ended Mar 2026 is 24.36% vs -3.05% in Mar 2025
YoY Growth in year ended Mar 2026 is 138.21% vs -2,008.33% in Mar 2025
About Diana Tea Company Ltd

Company Coordinates


