
Compare Saboo Sodium with Similar Stocks
Dashboard
Weak Long Term Fundamental Strength with a -5.74% CAGR growth in Operating Profits over the last 5 years
- Company's ability to service its debt is weak with a poor EBIT to Interest (avg) ratio of 0.90
- The company has been able to generate a Return on Equity (avg) of 0.88% signifying low profitability per unit of shareholders funds
Consistent Underperformance against the benchmark over the last 3 years
Total Returns (Price + Dividend) 
Saboo Sodium for the last several years.
Risk Adjusted Returns v/s
Returns Beta

News
Saboo Sodium Chloro Q1 FY27: Profit Surge Masks Deeper Structural Concerns
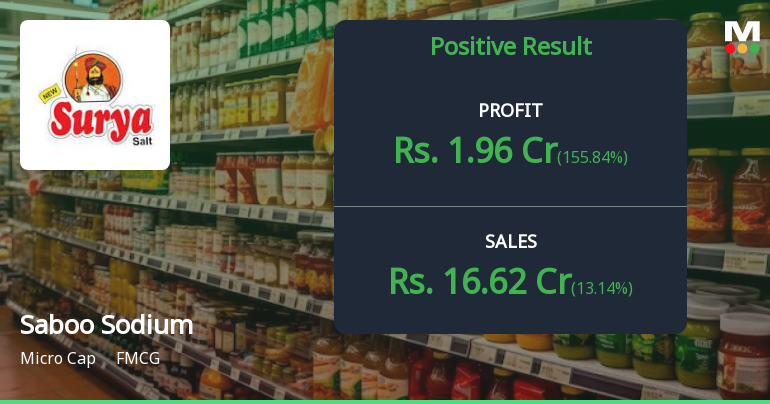
Saboo Sodium Chloro Ltd., North India's largest salt refinery, reported a dramatic turnaround in Q1 FY27 with net profit surging to ₹1.96 crores from ₹0.87 crores in the year-ago quarter, marking a 125.29% year-on-year growth. However, the micro-cap company's shares have struggled post-results, declining 19.17% over the past year to trade at ₹12.73, reflecting persistent investor concerns about the company's weak profitability metrics and deteriorating long-term fundamentals despite the quarterly profit spike.
Read full news article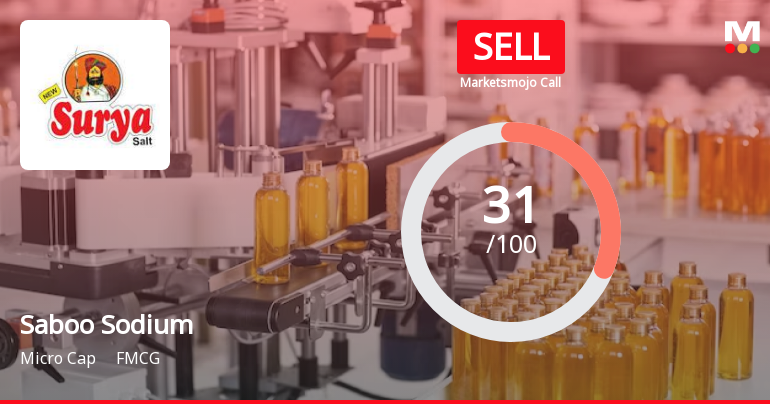
Saboo Sodium Chloro Ltd Upgraded to Sell Amid Mixed Financial and Technical Signals
Saboo Sodium Chloro Ltd has seen its investment rating upgraded from Strong Sell to Sell, driven primarily by a shift in technical indicators despite persistent fundamental challenges. The company’s micro-cap status and weak financial trends continue to weigh on investor sentiment, but recent technical signals suggest a mild easing of bearish momentum.
Read full news article Announcements
Board Meeting Intimation for The Meeting Of The Board Of Directors Of The Company Is Scheduled To Be Held On Thursday July 30 2026 At Its Registered Office.
25-Jul-2026 | Source : BSESaboo Sodium Chloro Ltdhas informed BSE that the meeting of the Board of Directors of the Company is scheduled on 30/07/2026 inter alia to consider and approve PDF attached
Announcement under Regulation 30 (LODR)-Press Release / Media Release
09-Jul-2026 | Source : BSEThe Companys Wholly Owned Subsidiary Receives Land Conversion order for Samskara Udaipur Luxury Resort Project; Integrated Development Proposed for upto 300 Rooms.
Compliances-Certificate under Reg. 74 (5) of SEBI (DP) Regulations 2018
04-Jul-2026 | Source : BSECompliance Certificate under Regulation 74 (5) of SEBI (DP) Regulations 2018 for the First Quarter ended 30th June 2026.
Corporate Actions

No Upcoming Board Meetings

No Dividend history available

No Splits history available

No Bonus history available

Saboo Sodium Chloro Ltd has announced 74:100 rights issue, ex-date: 15 Jun 22
Quality key factors
Valuation key factors
Technicals key factors
 Technical Indicator Scale: Bearish, Mildly Bearish, Sideways, Mildly Bullish, Bullish Turned
 Shareholding Snapshot : Jun 2026
Shareholding Compare (%holding)
Non Institution
None
Held by 5 Schemes (0.08%)
Held by 0 FIIs
Girdhar Saboo (45.72%)
Mahendra Girdharilal (1.59%)
43.22%
Quarterly Results Snapshot (Standalone) - Jun'26 - QoQ

QoQ Growth in quarter ended Jun 2026 is 13.14% vs -14.54% in Mar 2026
QoQ Growth in quarter ended Jun 2026 is 155.84% vs -512.94% in Mar 2026
Half Yearly Results Snapshot (Standalone) - Sep'25

Growth in half year ended Sep 2025 is 17.25% vs 28.45% in Sep 2024
Growth in half year ended Sep 2025 is 20.38% vs 349.15% in Sep 2024
Nine Monthly Results Snapshot (Standalone) - Dec'25
YoY Growth in nine months ended Dec 2025 is 18.30% vs 26.90% in Dec 2024
YoY Growth in nine months ended Dec 2025 is -1.70% vs 56.87% in Dec 2024
Annual Results Snapshot (Standalone) - Mar'26
YoY Growth in year ended Mar 2026 is 16.23% vs 6.24% in Mar 2025
YoY Growth in year ended Mar 2026 is -25.81% vs 34.78% in Mar 2025
About Saboo Sodium Chloro Ltd

Company Coordinates


