
Compare Vardhman Polytex with Similar Stocks
Dashboard
With a Negative Book Value, the company has a Weak Long Term Fundamental Strength
- Poor long term growth as Net Sales has grown by an annual rate of -14.17% and Operating profit at 0% over the last 5 years
- The company has a negative book value of Rs 220.60 crore
Negative results in Mar 26
Risky - Negative Book Value
60.34% of Promoter Shares are Pledged
Below par performance in long term as well as near term
Stock DNA
Garments & Apparels
INR 341 Cr (Micro Cap)
44.00
52
0.00%
-0.22
-3.48%
-1.53
Total Returns (Price + Dividend) 
Latest dividend: 0.9500 per share ex-dividend date: Sep-18-2008
Risk Adjusted Returns v/s
Returns Beta

News

Vardhman Polytex Ltd is Rated Strong Sell
Vardhman Polytex Ltd is rated Strong Sell by MarketsMOJO, with this rating last updated on 28 July 2025. However, the analysis and financial metrics discussed here reflect the company’s current position as of 11 June 2026, providing investors with an up-to-date view of the stock’s fundamentals, valuation, financial trends, and technical outlook.
Read full news article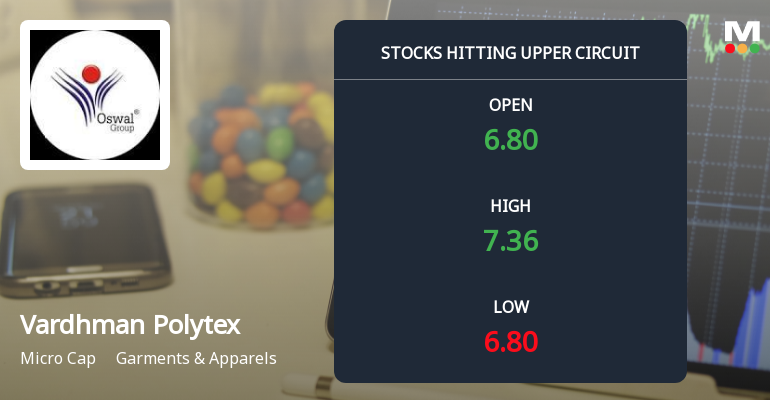
Vardhman Polytex Ltd Locks at Upper Circuit With 4.86% Gain — Buyers Queue, Sellers Absent
At Rs 7.33, the buying was done — not because demand dried up, but because the exchange wouldn't let the stock go any higher. Vardhman Polytex Ltd locked at its upper circuit of 4.86% on 4 Jun 2026, with buyers queuing and no sellers willing to part with shares.
Read full news article
Vardhman Polytex Ltd is Rated Strong Sell
Vardhman Polytex Ltd is rated Strong Sell by MarketsMOJO, with this rating last updated on 28 Jul 2025. However, the analysis and financial metrics presented here reflect the company’s current position as of 27 May 2026, providing investors with an up-to-date view of its fundamentals, valuation, financial trends, and technical outlook.
Read full news article Announcements
Announcement under Regulation 30 (LODR)-Newspaper Publication
01-Jun-2026 | Source : BSEDisclosure regarding newspaper publication of financial results for the period ended 31.03.2026 is attached herewith.
Board Meeting Outcome for Audited Financial Results For The Period Ended 31.03.2026
29-May-2026 | Source : BSEOutcome of board meeting held on 29.05.2026 inter-alia to consider and approve the audited financial results for the period ended 31.03.2026 is attached
Re-Appointment Of Cost Auditors Of The Company For FY 2026-27
29-May-2026 | Source : BSEDisclosure regarding re-appointment of cost auditors of the company for FY 2026-27 is attached.
Corporate Actions

No Upcoming Board Meetings

Vardhman Polytex Ltd has declared 20% dividend, ex-date: 18 Sep 08

Vardhman Polytex Ltd has announced 1:10 stock split, ex-date: 17 May 24

No Bonus history available

Vardhman Polytex Ltd has announced 7:23 rights issue, ex-date: 28 Aug 24
Quality key factors
Valuation key factors
Technicals key factors
 Technical Indicator Scale: Bearish, Mildly Bearish, Sideways, Mildly Bullish, Bullish Turned
 Shareholding Snapshot : Mar 2026
Shareholding Compare (%holding)
Non Institution
60.3441
Held by 2 Schemes (0.0%)
Held by 6 FIIs (5.63%)
Oswal Holding Private Limited (9.74%)
Anupama Kothari (10.35%)
48.91%
Quarterly Results Snapshot (Standalone) - Mar'26 - QoQ

QoQ Growth in quarter ended Mar 2026 is 28.16% vs -18.02% in Dec 2025
QoQ Growth in quarter ended Mar 2026 is 486.67% vs -97.68% in Dec 2025
Half Yearly Results Snapshot (Standalone) - Sep'25
Growth in half year ended Sep 2025 is -5.58% vs -45.61% in Sep 2024
Growth in half year ended Sep 2025 is 165.71% vs 69.35% in Sep 2024
Nine Monthly Results Snapshot (Standalone) - Dec'25
YoY Growth in nine months ended Dec 2025 is -15.66% vs -31.38% in Dec 2024

YoY Growth in nine months ended Dec 2025 is -51.22% vs 150.31% in Dec 2024
Annual Results Snapshot (Standalone) - Mar'26
YoY Growth in year ended Mar 2026 is -16.94% vs -23.11% in Mar 2025
YoY Growth in year ended Mar 2026 is -48.53% vs 155.75% in Mar 2025
About Vardhman Polytex Ltd

Company Coordinates


