
Compare Cybertech Sys. with Similar Stocks
Stock DNA
Computers - Software & Consulting
INR 476 Cr (Micro Cap)
16.00
20
15.42%
-0.74
14.33%
2.28
Total Returns (Price + Dividend) 
Latest dividend: 20 per share ex-dividend date: Oct-06-2025
Risk Adjusted Returns v/s
Returns Beta

News
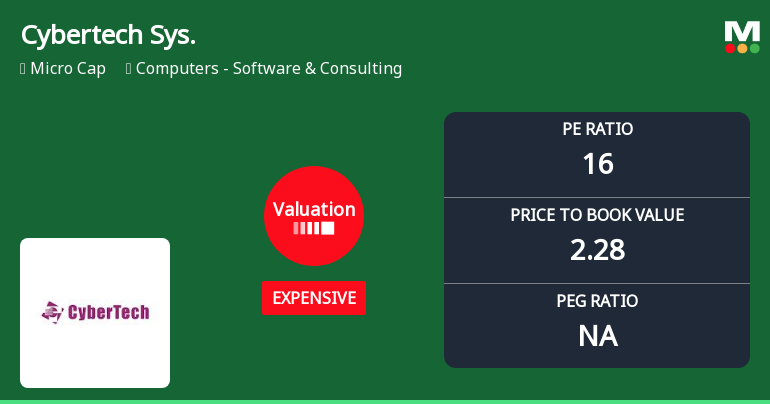
Cybertech Systems & Software Ltd Valuation Shifts Signal Caution for Investors
Cybertech Systems & Software Ltd has experienced a notable shift in its valuation parameters, moving from a fair to an expensive rating, reflecting a change in price attractiveness amid evolving market dynamics and peer comparisons within the Computers - Software & Consulting sector.
Read full news article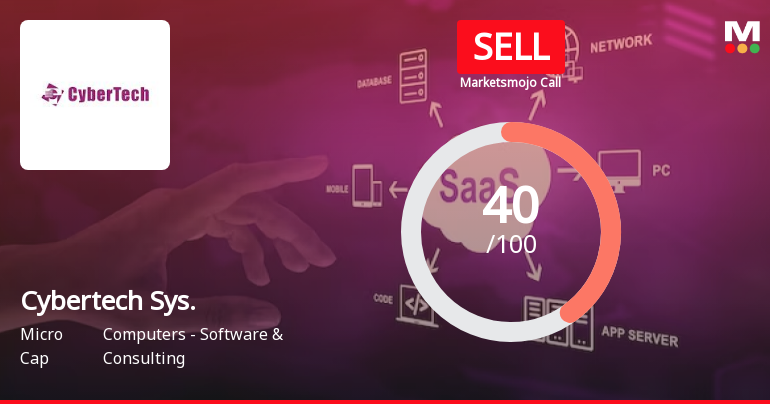
Cybertech Systems & Software Ltd is Rated Sell
Cybertech Systems & Software Ltd is rated 'Sell' by MarketsMOJO. This rating was last updated on 15 May 2026, reflecting a reassessment of the stock’s outlook. However, all fundamentals, returns, and financial metrics discussed below are current as of 21 June 2026, providing investors with the latest view of the company’s position in the market.
Read full news article
Cybertech Systems & Software Ltd is Rated Sell
Cybertech Systems & Software Ltd is rated 'Sell' by MarketsMOJO, with this rating last updated on 15 May 2026. However, the analysis and data presented here reflect the stock's current position as of 10 June 2026, providing investors with an up-to-date view of its fundamentals, returns, and financial metrics.
Read full news article Announcements
Announcement under Regulation 30 (LODR)-Closure of Buy Back
23-Jun-2026 | Source : BSEExtinguishment of 850000 equity shares of the Company.
Announcement under Regulation 30 (LODR)-Post Buyback Public Announcement
19-Jun-2026 | Source : BSENewspaper Advertisement for Post Buyback Announcement
Announcement under Regulation 30 (LODR)-Newspaper Publication
03-Jun-2026 | Source : BSENewspaper Advertisement
Corporate Actions

No Upcoming Board Meetings

Cybertech Systems & Software Ltd has declared 200% dividend, ex-date: 06 Oct 25

No Splits history available

No Bonus history available

No Rights history available
Quality key factors
Valuation key factors
Technicals key factors
 Technical Indicator Scale: Bearish, Mildly Bearish, Sideways, Mildly Bullish, Bullish Turned
 Shareholding Snapshot : Mar 2026
Shareholding Compare (%holding)
Non Institution
None
Held by 0 Schemes
Held by 3 FIIs (0.16%)
Viswanath Tadimety (15.03%)
Indotech Holdings Llc (17.5%)
32.72%
Quarterly Results Snapshot (Consolidated) - Mar'26 - QoQ

QoQ Growth in quarter ended Mar 2026 is 7.76% vs -1.62% in Dec 2025
QoQ Growth in quarter ended Mar 2026 is 8.27% vs -24.60% in Dec 2025
Half Yearly Results Snapshot (Consolidated) - Sep'25

Growth in half year ended Sep 2025 is 0.99% vs 4.72% in Sep 2024
Growth in half year ended Sep 2025 is 3.25% vs 60.12% in Sep 2024
Nine Monthly Results Snapshot (Consolidated) - Dec'25
YoY Growth in nine months ended Dec 2025 is 0.24% vs 5.55% in Dec 2024
YoY Growth in nine months ended Dec 2025 is -7.81% vs 61.71% in Dec 2024
Annual Results Snapshot (Consolidated) - Mar'26
YoY Growth in year ended Mar 2026 is 0.53% vs 6.39% in Mar 2025
YoY Growth in year ended Mar 2026 is -12.88% vs 53.61% in Mar 2025
About Cybertech Systems & Software Ltd

Company Coordinates


