
Compare Guj. Craft Inds with Similar Stocks
Dashboard
Weak Long Term Fundamental Strength with an average Return on Capital Employed (ROCE) of 8.09%
- Poor long term growth as Net Sales has grown by an annual rate of 4.51% and Operating profit at 2.80% over the last 5 years
- Low ability to service debt as the company has a high Debt to EBITDA ratio of 5.56 times
Negative results in Mar 26
Below par performance in long term as well as near term
Total Returns (Price + Dividend) 
Latest dividend: 1 per share ex-dividend date: Sep-22-2025
Risk Adjusted Returns v/s
Returns Beta

News

Gujarat Craft Industries Ltd is Rated Strong Sell
Gujarat Craft Industries Ltd is rated Strong Sell by MarketsMOJO, with this rating last updated on 31 July 2025. However, the analysis and financial metrics discussed here reflect the company’s current position as of 18 June 2026, providing investors with an up-to-date view of the stock’s fundamentals, returns, and technical outlook.
Read full news article
Gujarat Craft Industries Ltd is Rated Strong Sell
Gujarat Craft Industries Ltd is rated Strong Sell by MarketsMOJO, with this rating last updated on 31 July 2025. However, the analysis and financial metrics discussed here reflect the company’s current position as of 04 June 2026, providing investors with the latest insights into its performance and outlook.
Read full news article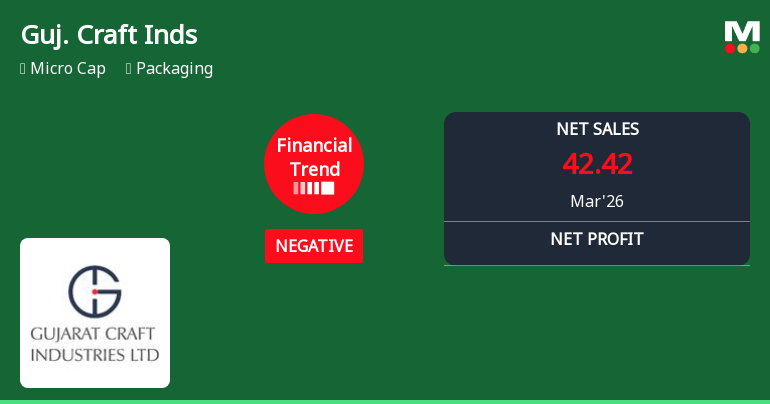
Gujarat Craft Industries Ltd Reports Sharp Decline in Quarterly Financial Performance Amid Negative Trend Shift
Gujarat Craft Industries Ltd, a micro-cap player in the packaging sector, has reported a marked deterioration in its financial performance for the quarter ended March 2026. The company’s financial trend has shifted from flat to negative, with key metrics such as revenue, profitability, and margins showing significant contraction compared to previous quarters and historical benchmarks.
Read full news article Announcements
Announcement under Regulation 30 (LODR)-Change in Management
04-Jun-2026 | Source : BSEThis is to inform you that Ms. Jhanvi Jansari has resigned from the post of Chief finance officer of the Company with effect from closer of business hours of the Company on 4th June 2026 to explore new opportunities in different industry.
Announcement under Regulation 30 (LODR)-Resignation of Chief Financial Officer (CFO)
04-Jun-2026 | Source : BSEThis is to inform you that Ms. jhanvi Jansari has resigned from the post of Chief Finance officer of the company with effect from the closer of bussines hours of the company on 4th June 2026 to explore the new opportunities in different industry.
Compliances-Reg.24(A)-Annual Secretarial Compliance
22-May-2026 | Source : BSEWe are attaching here with Annual Secretarial Compliance Report for the Financial Year 25-26 issued by M/s. Kashyap R. Mehta and Partners Company Secretaries.
Corporate Actions

No Upcoming Board Meetings

Gujarat Craft Industries Ltd has declared 10% dividend, ex-date: 22 Sep 25

No Splits history available

No Bonus history available

No Rights history available
Quality key factors
Valuation key factors
Technicals key factors
 Technical Indicator Scale: Bearish, Mildly Bearish, Sideways, Mildly Bullish, Bullish Turned
 Shareholding Snapshot : Mar 2026
Shareholding Compare (%holding)
Promoters
None
Held by 0 Schemes
Held by 1 FIIs (0.12%)
Sushma Chhajer (39.33%)
None
23.37%
Quarterly Results Snapshot (Standalone) - Mar'26 - QoQ

QoQ Growth in quarter ended Mar 2026 is -14.48% vs 11.49% in Dec 2025
QoQ Growth in quarter ended Mar 2026 is -180.00% vs -90.57% in Dec 2025
Half Yearly Results Snapshot (Standalone) - Sep'25
Growth in half year ended Sep 2025 is 6.05% vs 13.59% in Sep 2024

Growth in half year ended Sep 2025 is -13.64% vs -37.50% in Sep 2024
Nine Monthly Results Snapshot (Standalone) - Dec'25
YoY Growth in nine months ended Dec 2025 is 1.32% vs 14.63% in Dec 2024
YoY Growth in nine months ended Dec 2025 is -46.52% vs -17.26% in Dec 2024
Annual Results Snapshot (Standalone) - Mar'26
YoY Growth in year ended Mar 2026 is -9.28% vs 15.57% in Mar 2025
YoY Growth in year ended Mar 2026 is -63.94% vs -11.22% in Mar 2025
About Gujarat Craft Industries Ltd

Company Coordinates


