
Compare Aditya Spinners with Similar Stocks
Dashboard
Weak Long Term Fundamental Strength with a -164.31% CAGR growth in Operating Profits over the last 5 years
- Company's ability to service its debt is weak with a poor EBIT to Interest (avg) ratio of 1.15
- The company has been able to generate a Return on Equity (avg) of 4.93% signifying low profitability per unit of shareholders funds
Risky - Negative Operating Profits
Below par performance in long term as well as near term
Stock DNA
Garments & Apparels
INR 26 Cr (Micro Cap)
90.00
25
0.00%
0.36
0.68%
0.57
Total Returns (Price + Dividend) 
Aditya Spinners for the last several years.
Risk Adjusted Returns v/s
Returns Beta

News
Are Aditya Spinners Ltd latest results good or bad?
Aditya Spinners Ltd's latest financial results present a complex picture marked by contrasting operational trends. In the quarter ended March 2026, the company reported net sales of ₹13.68 crores, reflecting a year-on-year decline of 1.87%. This marks a continuation of revenue challenges, as the company has struggled to maintain consistent sales performance amidst a difficult market environment. Notably, the net sales for this quarter also represent a significant quarter-on-quarter contraction of 15.29%, indicating a concerning decline in demand. Conversely, the company achieved a net profit of ₹1.47 crores for the same quarter, a substantial turnaround from a loss of ₹0.21 crores in the previous year. This impressive growth in net profit, quantified at 800%, is primarily attributed to an exceptional tax reversal rather than sustainable operational performance. The operating margin improved to 7.24%, up 27...
Read full news article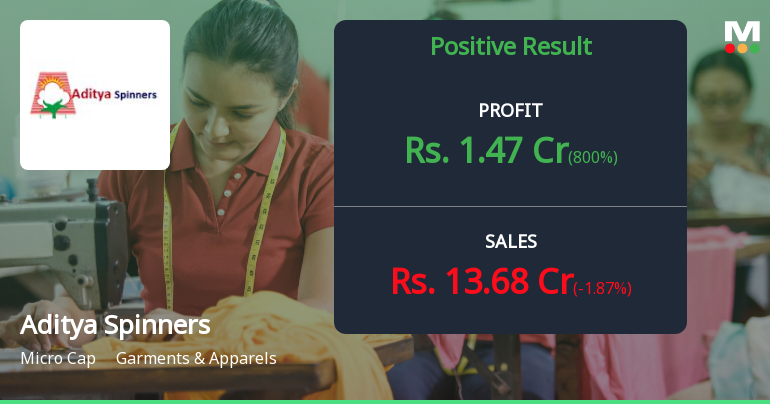
Aditya Spinners Q4 FY26: Tax Reversal Masks Operational Weakness
Aditya Spinners Ltd., a micro-cap textile manufacturer specialising in synthetic blended yarn, reported a dramatic swing to profitability in Q4 FY26, posting a net profit of ₹1.47 crores compared to a loss of ₹0.21 crores in the year-ago quarter. However, the positive headline number conceals a troubling reality: the entire profit was driven by an exceptional tax reversal of ₹1.25 crores, whilst core operations remained under severe pressure with sales declining 15.29% quarter-on-quarter to ₹13.68 crores.
Read full news article Announcements
Announcement under Regulation 30 (LODR)-Change in Directorate
23-May-2026 | Source : BSERe-appointment of Sri Vijayulu Reddy Kaliki for second tenure of five years subject to approval of members
Board Meeting Outcome for OUTCOME OF BOARD MEETING HELD ON 22ND MAY 2026
22-May-2026 | Source : BSEOUTCOME OF BOARD MEETING HELD ON 22ND MAY 2026
Results-Financial Results For March 31 2026
22-May-2026 | Source : BSEResults/Integrated Filing(FInance) for period ended March 31 2026
Corporate Actions

No Upcoming Board Meetings

No Dividend history available

Aditya Spinners Ltd has announced 10:4 stock split, ex-date: 02 Mar 12

No Bonus history available

No Rights history available
Quality key factors
Valuation key factors
Technicals key factors
 Technical Indicator Scale: Bearish, Mildly Bearish, Sideways, Mildly Bullish, Bullish Turned
 Shareholding Snapshot : Mar 2026
Shareholding Compare (%holding)
Promoters
None
Held by 7 Schemes (0.53%)
Held by 2 FIIs (0.0%)
Vijay Kumar Kapilavai (30.35%)
Mahendra Girdharilal (3.34%)
31.37%
Quarterly Results Snapshot (Standalone) - Mar'26 - YoY

YoY Growth in quarter ended Mar 2026 is -1.87% vs 7.98% in Mar 2025

YoY Growth in quarter ended Mar 2026 is 800.00% vs -114.09% in Mar 2025
Half Yearly Results Snapshot (Standalone) - Sep'25
Growth in half year ended Sep 2025 is 8.86% vs -2.89% in Sep 2024
Growth in half year ended Sep 2025 is 7.32% vs -510.00% in Sep 2024
Nine Monthly Results Snapshot (Standalone) - Dec'25
YoY Growth in nine months ended Dec 2025 is 4.33% vs -1.22% in Dec 2024
YoY Growth in nine months ended Dec 2025 is 28.40% vs -550.00% in Dec 2024
Annual Results Snapshot (Standalone) - Mar'26
YoY Growth in year ended Mar 2026 is 2.92% vs 0.73% in Mar 2025
YoY Growth in year ended Mar 2026 is 109.20% vs -281.18% in Mar 2025
About Aditya Spinners Ltd

Company Coordinates


