
Compare Katare Spinning with Similar Stocks
Dashboard
With a Operating Losses, the company has a Weak Long Term Fundamental Strength
- Company's ability to service its debt is weak with a poor EBIT to Interest (avg) ratio of -0.93
- The company has reported losses. Due to this company has reported negative ROCE
Flat results in Mar 26
Risky - Negative EBITDA
Stock DNA
Garments & Apparels
INR 29 Cr (Micro Cap)
NA (Loss Making)
52
0.00%
0.03
-1.90%
0.25
Total Returns (Price + Dividend) 
Latest dividend: 1.0000 per share ex-dividend date: Aug-21-2013
Risk Adjusted Returns v/s
Returns Beta

News

Katare Spinning Mills Ltd is Rated Strong Sell
Katare Spinning Mills Ltd is rated Strong Sell by MarketsMOJO, with this rating last updated on 04 Dec 2023. However, the analysis and financial metrics presented here reflect the company’s current position as of 09 July 2026, providing investors with an up-to-date view of its fundamentals, valuation, financial trends, and technical outlook.
Read full news articleAre Katare Spinning Mills Ltd latest results good or bad?
Katare Spinning Mills Ltd's latest financial results for Q4 FY26 indicate a challenging operational environment. The company reported a net loss of ₹1.28 crores, which represents a significant deterioration compared to the same quarter last year, reflecting a year-on-year decline of 197.67%. Revenue for the quarter was ₹0.98 crores, down 29.50% from ₹1.39 crores in Q4 FY25, and also showed a quarter-on-quarter decline of 3.92% from ₹1.02 crores in Q3 FY26. The operating margin for Q4 FY26 was recorded at -72.45%, indicating substantial operational inefficiencies, as the company lost ₹0.72 for every rupee of revenue generated. The profit after tax (PAT) margin also reflected deep losses, standing at -130.61%. This trend of negative profitability metrics underscores the severity of the company's operational crisis. The financial trajectory has shown extreme volatility, with quarterly revenues fluctuating si...
Read full news article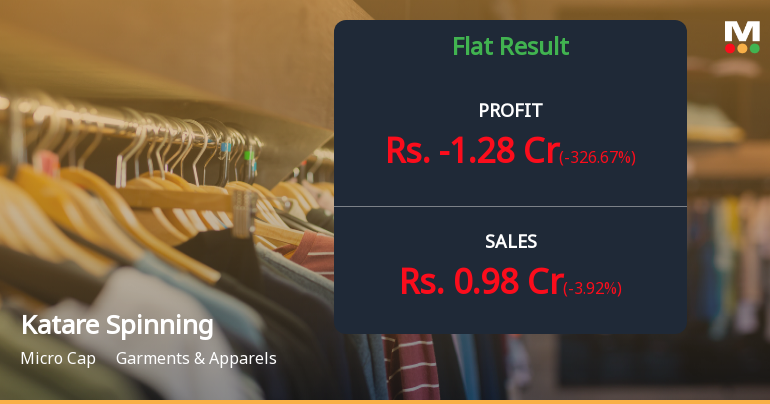
Katare Spinning Mills Q4 FY26: Mounting Losses Deepen as Operational Crisis Persists
Katare Spinning Mills Limited, the Solapur-based textile manufacturer, reported a devastating fourth quarter for FY26, with net losses widening to ₹1.28 crores compared to ₹0.43 crores in the corresponding quarter last year—a staggering deterioration of 197.67%. The micro-cap company, with a market capitalisation of just ₹30.00 crores, continues to grapple with severe operational challenges that have eroded shareholder value by 38.64% over the past year, significantly underperforming both the Sensex and its sector peers.
Read full news article Announcements
Compliances-Certificate under Reg. 74 (5) of SEBI (DP) Regulations 2018
15-Jul-2026 | Source : BSEEnclosed herewith the Certificate under Regulation 74(5) of the SEBI (DP) Regulations 2018 for the quarter ended 30th June 2026 for your information.
Closure of Trading Window
03-Jul-2026 | Source : BSEEnclosed herewith the Intimation of closure of Trading window for June 2026 quarter in terms of SEBI (Prohibition of Insider Trading) regulations 2015 for your reference.
Declaration With Respect To Non-Applicability Of Large Entities Framework Pursuant To SEBI Circular To The Company.
17-Jun-2026 | Source : BSEEnclosed herewith the declaration with respect to non-applicability of large entities framework pursuant to SEBI circular to the Company.
Corporate Actions

No Upcoming Board Meetings

Katare Spinning Mills Ltd has declared 10% dividend, ex-date: 21 Aug 13

No Splits history available

No Bonus history available

No Rights history available
Quality key factors
Valuation key factors
Technicals key factors
 Technical Indicator Scale: Bearish, Mildly Bearish, Sideways, Mildly Bullish, Bullish Turned
 Shareholding Snapshot : Jun 2026
Shareholding Compare (%holding)
Non Institution
None
Held by 0 Schemes
Held by 0 FIIs
Kishore Tippanna Katare (21.43%)
Krishnagopal Motilal Chandak (4.83%)
44.41%
Quarterly Results Snapshot (Standalone) - Mar'26 - QoQ

QoQ Growth in quarter ended Mar 2026 is -3.92% vs 827.27% in Dec 2025
QoQ Growth in quarter ended Mar 2026 is -326.67% vs 6.25% in Dec 2025
Half Yearly Results Snapshot (Standalone) - Sep'25
Growth in half year ended Sep 2025 is -51.23% vs 5.19% in Sep 2024

Growth in half year ended Sep 2025 is 33.71% vs -456.25% in Sep 2024
Nine Monthly Results Snapshot (Standalone) - Dec'25
YoY Growth in nine months ended Dec 2025 is -51.47% vs 19.94% in Dec 2024
YoY Growth in nine months ended Dec 2025 is 31.54% vs -712.50% in Dec 2024
Annual Results Snapshot (Standalone) - Mar'26
YoY Growth in year ended Mar 2026 is -45.51% vs 28.00% in Mar 2025
YoY Growth in year ended Mar 2026 is -24.86% vs 7.49% in Mar 2025
About Katare Spinning Mills Ltd

Company Coordinates


