Mitshi India

  • Market Cap: Micro Cap
  • Industry: Trading & Distributors
  • ISIN: INE844D01017
  • NSEID:
  • BSEID: 523782
INR
13.63
-0.01 (-0.07%)
BSENSE

Jan 19

BSE+NSE Vol: 690

  • Price Points
  • Score
  • Mojo Parameters
  • Total Return
  • News and Corporate Actions
  • Key factors
  • Shareholding
  • Financials
  • CompanyCV
stock-summaryPrice Point
High/Low

1Day

52 Week

Valuation
Technical
Day's Volume

CASH

690 (31.68%) Volume

Shareholding (Sep 2025)

FII

0.00%

Held by 0 FIIs

DII

0.01%

Held by 0 DIIs

Promoter

15.57%

Who are in the management team of Mitshi India?

06-Jun-2025

As of March 2023, the management team of Mitshi India includes Kumar V Shah (Chairman & Managing Director), H A Salunkhe (Independent Director), Drashti T Savla (Independent Director), and Umesh Mistry (Company Secretary & Compliance Officer). Kumar V Shah receives a remuneration of Rs. 9.0 lacs, while the other members do not receive remuneration.

As of March 2023, the management team of Mitshi India includes the following individuals:<BR><BR>1. Kumar V Shah - Chairman & Managing Director, with a remuneration of Rs. 9.0 lacs.<BR>2. H A Salunkhe - Independent Director, with no remuneration.<BR>3. Drashti T Savla - Independent Director, with no remuneration.<BR>4. Umesh Mistry - Company Secretary & Compliance Officer, with no remuneration.<BR><BR>This team is responsible for overseeing the company's operations and governance.

View full answer

What does Mitshi India do?

06-Jun-2025

Mitshi India Ltd is a micro-cap company in the Trading & Distributors industry, specializing in industrial solvents and raw materials. Incorporated in 1990, it reported net sales of 1 Cr and a net profit of 0 Cr for the quarter ending March 2025.

Overview:<BR>Mitshi India Ltd operates in the Trading & Distributors industry as a micro-cap company, focusing on the trading of industrial solvents and raw materials.<BR><BR>History:<BR>Mitshi India Ltd was incorporated on July 23, 1990, and was formerly known as Dera Paints and Chemicals Ltd until its name change in February 2016. The latest quarterly results reported net sales and net profit for the period ending March 2025.<BR><BR>Financial Snapshot:<BR>- Net Sales: 1 Cr (Quarterly Results - Mar 2025)<BR>- Net Profit: 0 Cr (Quarterly Results - Mar 2025)<BR>- Market-cap: Rs 14 Cr (Micro Cap)<BR><BR>Key Metrics:<BR>- P/E: N/A<BR>- Industry P/E: 30<BR>- Dividend Yield: 0.00%<BR>- Debt-Equity: -0.02<BR>- Return on Equity: -0.37%<BR>- Price to Book: 5.01<BR><BR>Contact Details:<BR>Address: 2 Juhu Aradhana CHS Ltd, Juhu Lane Mumbai Maharashtra : 400058<BR>Tel: 91-022-26481711<BR>Email: derapaints@gmail.com<BR>Website: http://www.mitshi.in

View full answer

Has Mitshi India declared dividend?

06-Jun-2025

No Dividend History Available

Who are the peers of the Mitshi India?

03-Jun-2025

Mitshi India's peers include Redington, MMTC, MSTC, Ravindra Energy, New Light Appare, Risa International, Fruition Venture, Sh. Ganesh Elas., and Catvision Ltd. Redington shows excellent management and growth, while Ravindra Energy has the highest 1-year return at 141.63%, and Mitshi India's return is -26.26%.

Peers: The peers of Mitshi India are Redington, MMTC, MSTC, Ravindra Energy, New Light Appare, Risa Internatio., Fruition Venture, Sh. Ganesh Elas., and Catvision Ltd.<BR><BR>Quality Snapshot: Excellent management risk is observed at Redington, while Average management risk is found at MMTC, MSTC, and Sh. Ganesh Elas., and the rest have Below Average management risk. Growth is Excellent at Redington, while Average growth is noted at MMTC, MSTC, and Sh. Ganesh Elas., and the rest exhibit Below Average growth. Capital Structure is rated as Good at Redington, Excellent at MSTC, and Average at Sh. Ganesh Elas., while the rest have Below Average capital structure.<BR><BR>Return Snapshot: Ravindra Energy has the highest 1-year return at 141.63%, while Fruition Venture has the lowest at -51.53%. Mitshi India's own 1-year return is -26.26%, which is higher than Fruition Venture's but lower than Ravindra Energy's. Additionally, MSTC, New Light Appare, Fruition Venture, Sh. Ganesh Elas., and Catvision Ltd have negative six-month returns.

View full answer

Is Mitshi India overvalued or undervalued?

09-Jun-2025

As of August 13, 2024, Mitshi India is considered overvalued and risky due to its negative PE ratio of -13.73 and significant financial distress, despite a low PEG ratio of 0.00 compared to peers like MMTC and Elitecon International.

As of 13 August 2024, Mitshi India has moved from an expensive to a risky valuation grade. The company appears to be overvalued given its negative PE ratio of -13.73, an EV to EBITDA of -13.67, and a Price to Book Value of 5.05. These ratios indicate significant financial distress and a lack of profitability, which is concerning for potential investors.<BR><BR>In comparison to its peers, Mitshi India stands out with a notably low PEG ratio of 0.00, while MMTC, another peer, has a PE ratio of 119.39, indicating a stark contrast in valuation metrics. Furthermore, Elitecon International is categorized as very expensive with a PE ratio of 131.08, highlighting the relative risk associated with Mitshi India. Despite a recent positive trend in stock performance compared to the Sensex over the past week and month, the overall financial indicators suggest that Mitshi India is overvalued in the current market environment.

View full answer

What is the technical trend for Mitshi India?

09-Jun-2025

As of June 3, 2025, Mitshi India shows a mildly bearish trend due to daily moving averages and weekly Bollinger Bands indicating bearishness, despite some mildly bullish signals from the MACD and KST, with a significant 24.43% decline over the past year compared to a 7.51% gain in the Sensex.

As of 3 June 2025, the technical trend for Mitshi India has changed from bearish to mildly bearish. The current stance is mildly bearish, primarily driven by the daily moving averages indicating a bearish trend and the weekly Bollinger Bands also reflecting a mildly bearish outlook. While the weekly MACD and KST show mildly bullish signals, the overall monthly indicators remain bearish, suggesting a lack of strong upward momentum. The stock's performance has been underwhelming over the longer term, with a significant decline of 24.43% over the past year compared to a 7.51% gain in the Sensex, further supporting the bearish sentiment.

View full answer

Who are the top shareholders of the Mitshi India?

17-Jul-2025

The top shareholders of Mitshi India include Kumar V Shah with 9.4%, Solfic Infotech Private Limited at 19.24%, and individual investors holding 60.28%. There are no pledged promoter holdings, and the company has no mutual funds or foreign institutional investors involved.

The top shareholders of Mitshi India include Kumar V Shah, who is the promoter with the highest holding at 9.4%. The highest public shareholder is Solfic Infotech Private Limited, holding 19.24%. Additionally, individual investors collectively hold a significant portion of the shares at 60.28%. Notably, there are no pledged promoter holdings, and the company does not have any mutual funds or foreign institutional investors holding shares.

View full answer

How big is Mitshi India?

24-Jul-2025

As of 24th July, Mitshi India Ltd has a market capitalization of 13.00 Cr, with recent net sales of 8.16 Cr and a net profit of 0.56 Cr. The company has shareholder's funds of 1.86 Cr and total assets of 4.30 Cr.

As of 24th July, Mitshi India Ltd has a market capitalization of 13.00 Cr, categorizing it as a Micro Cap company.<BR><BR>For the latest four quarters, Mitshi India reported Net Sales of 8.16 Cr and a Net Profit of 0.56 Cr.<BR><BR>As of the latest annual period, the company has Shareholder's Funds of 1.86 Cr and Total Assets amounting to 4.30 Cr.

View full answer

Are Mitshi India latest results good or bad?

13-Aug-2025

Mitshi India's latest results are concerning, with a 60.19% decline in net sales and a low Debtors Turnover Ratio, despite a 100% increase in net profit from a very low base. The overall performance is weak, leading to a current stock recommendation of 'Strong Sell.'

Mitshi India's latest financial results for the quarter ending June 2025 indicate a challenging situation for the company. The net sales have significantly declined by 60.19% compared to the previous quarter, which raises concerns about its revenue generation capabilities. Although the standalone net profit showed a remarkable increase of 100% from the previous quarter, it is important to note that this figure was coming from a very low base, as the company had reported a net profit of zero in the prior period.<BR><BR>Additionally, the Debtors Turnover Ratio has dropped to its lowest level in recent periods, suggesting that the company is struggling to collect payments from its customers efficiently. This could impact its liquidity and operational efficiency moving forward. The overall financial health score has decreased, and the current stock recommendation is a 'Strong Sell,' reflecting significant concerns about the company's stability.<BR><BR>In summary, while there was a positive shift in net profit, the overall performance is considered weak due to the steep decline in sales and other financial metrics. Stakeholders should remain cautious as the company navigates these challenges.

View full answer

When is the next results date for Mitshi India?

07-Nov-2025

The next results date for Mitshi India is 13 November 2025.

The next results date for Mitshi India is scheduled for 13 November 2025.

View full answer

How has been the historical performance of Mitshi India?

14-Nov-2025

Mitshi India showed significant sales growth from INR 2.93 crore in March 2018 to INR 9.74 crore in March 2020, but profitability declined, with operating profit and profit after tax decreasing in the latest fiscal year. Additionally, cash flow from operating activities turned negative in March 2020.

Answer:<BR>The historical performance of Mitshi India shows a fluctuating trend in key financial metrics over the past three years.<BR><BR>Breakdown:<BR>Mitshi India's net sales increased significantly from INR 2.93 crore in March 2018 to INR 9.74 crore in March 2020, reflecting strong growth. However, the total operating income followed the same trend, rising from INR 2.93 crore in March 2018 to INR 9.74 crore in March 2020. Despite this growth, the operating profit (PBDIT) decreased from INR 1.26 crore in March 2019 to INR 0.90 crore in March 2020, indicating a decline in profitability. The profit after tax also saw a decrease from INR 0.93 crore in March 2019 to INR 0.60 crore in March 2020. The company's total liabilities increased from INR 1.97 crore in March 2018 to INR 4.30 crore in March 2020, while total assets rose from INR 1.97 crore to INR 4.30 crore in the same period. Cash flow from operating activities turned negative in March 2020 at INR -1.00 crore, contrasting with previous years where it was positive. Overall, while Mitshi India experienced growth in sales and total income, profitability and cash flow faced challenges in the latest fiscal year.

View full answer

Should I buy, sell or hold Mitshi India?

16-Nov-2025

Why is Mitshi India Ltd falling/rising?

18-Jan-2026

As of 18-Jan, Mitshi India Ltd's stock price is at Rs 13.69, reflecting a slight rise but has declined by 5.19% over the past month and 10.23% over the last year. Despite recent gains, long-term fundamentals are weak, indicating it may not be a strong investment choice.

As of 18-Jan, Mitshi India Ltd's stock price is experiencing a slight rise, currently at Rs 13.69, which reflects an increase of 0.07 or 0.51%. This uptick comes after the stock has gained for the last two consecutive days, resulting in a total return of 4.66% during this period. Additionally, the stock has outperformed its sector by 1.06% today.<BR><BR>However, despite this recent positive movement, the stock has shown a negative trend over longer periods. For instance, it has declined by 5.19% over the past month and 10.23% over the last year, significantly underperforming the broader market, which has seen a return of 8.47% in the same timeframe. The stock is also close to its 52-week low, being only 4.97% away from Rs 13.01.<BR><BR>Investor participation appears to be declining, as evidenced by a significant drop in delivery volume, which fell by 80.59% against the 5-day average. This decrease in trading activity may indicate waning interest among investors, which could contribute to the stock's volatility.<BR><BR>Overall, while there is a short-term rise in the stock price, the long-term fundamentals remain weak, with a negative CAGR growth in operating profits and a poor EBIT to interest ratio, suggesting that the stock may not be a strong investment choice moving forward.

View full answer

Which are the latest news on Mitshi India?

19-Jan-2026

iScoreScore
Click here to find our call on this stock
Strong Sell
Sell
Hold
Buy
Strong Buy

MarketsMojo — Loved in India, Now Global

The power of Mojo is now in 29 countries. Explore global equities with the same cutting-edge features you love.

Dashboard

1

Weak Long Term Fundamental Strength with a -1.44% CAGR growth in Operating Profits over the last 5 years

  • Company's ability to service its debt is weak with a poor EBIT to Interest (avg) ratio of -0.15
  • The company has been able to generate a Return on Equity (avg) of 4.77% signifying low profitability per unit of shareholders funds
2

Flat results in Sep 25

3

With ROE of -0.7, it has a Very Expensive valuation with a 4.4 Price to Book Value

4

Underperformed the market in the last 1 year

stock-summaryMojo Parameters

Mojo Parameters

Loading Valuation Snapshot...

Stock DNA

stock-summary
Industry

Trading & Distributors

stock-summary
Market cap

INR 12 Cr (Micro Cap)

stock-summary
P/E

NA (Loss Making)

stock-summary
Industry P/E

28

stock-summary
Dividend Yield

0.00%

stock-summary
Debt Equity

-0.06

stock-summary
Return on Equity

-0.74%

stock-summary
Price to Book

4.43

Revenue and Profits:
Net Sales:
1 Cr
(Quarterly Results - Sep 2025)
Net Profit:
stock-summaryTotal Returns
Total Returns (Price + Dividend) stock-summary
Dividend Yield (0%)
TimePeriod
Price Return
Dividend Return
Total Return
3 Months
-13.18%
0%
-13.18%
6 Months
-12.52%
0%
-12.52%
1 Year
-12.01%
0%
-12.01%
2 Years
-59.35%
0%
-59.35%
3 Years
50.61%
0%
50.61%
4 Years
-15.66%
0%
-15.66%
5 Years
-28.83%
0%
-28.83%

Mitshi India for the last several years.

Risk Adjusted Returns v/s stock-summary
Returns Beta
Icon
Beta has not been calculated since enough price history is not available
stock-summaryNews & Corporate Actions

News

Why is Mitshi India Ltd falling/rising?

Recent Price Movement and Market Context

Mitshi India Ltd’s share price has underperformed significantly against the broader market indices and its sector peers. Over the past week, the stock has declined by 6.24%, compared to a 1.69% drop in the Sensex. The one-month and year-to-date returns are similarly disappointing, with losses of 9.61% and 9.48% respectively, while the Sensex has only fallen by around 1.9% in these periods. Most notably, the stock has delivered a negative return of 20.24% over the last year, in stark contrast to the Sensex’s positive gain of 9.56% during the same timeframe.

On the day in question, the stock underperformed its sector by nearly 3%, with sector trading volumes also down by 2.06%. Mitshi India is trading below all key moving averages...

Read full news article
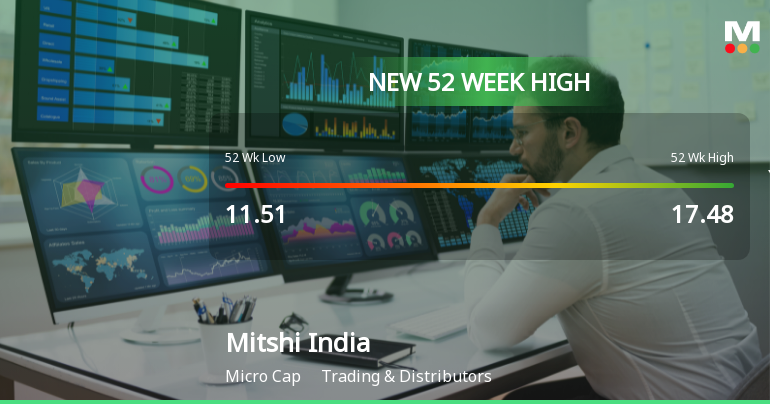
Announcements stock-summary

Compliances-Certificate under Reg. 74 (5) of SEBI (DP) Regulations 2018

12-Jan-2026 | Source : BSE

We hereby submit certificate under 74(5) of SEBI (DP) Regulation 2018 for the quarter ended 31st December 2025

Closure of Trading Window

31-Dec-2025 | Source : BSE

Closure of trading window for unaudited financial results for the quarter ended 31st December 2025

Announcement under Regulation 30 (LODR)-Newspaper Publication

17-Nov-2025 | Source : BSE

Newspaper Publication of the Financial Result of the company for the quarter and half year ended 30th September 2025

Corporate Actions stock-summary

stock-summary
BOARD MEETING

No Upcoming Board Meetings

stock-summary
DIVIDEND

No Dividend history available

stock-summary
SPLITS

No Splits history available

stock-summary
BONUS

No Bonus history available

stock-summary
RIGHTS

No Rights history available

stock-summaryKey Factors

Quality key factors stock-summary

Factor
Value
Sales Growth (5y)
-13.69%
EBIT Growth (5y)
-1.44%
EBIT to Interest (avg)
-0.15
Debt to EBITDA (avg)
0.22
Net Debt to Equity (avg)
-0.06
Sales to Capital Employed (avg)
2.98
Tax Ratio
10.00%
Dividend Payout Ratio
0
Pledged Shares
0
Institutional Holding
0.01%
ROCE (avg)
-5.62%
ROE (avg)
4.77%

Valuation key factors

Factor
Value
P/E Ratio
NA (Loss Making)
Industry P/E
28
Price to Book Value
4.41
EV to EBIT
11.83
EV to EBITDA
11.83
EV to Capital Employed
4.62
EV to Sales
3.59
PEG Ratio
NA
Dividend Yield
NA
ROCE (Latest)
0.39%
ROE (Latest)
-0.74%

Technicals key factors

Indicator
Weekly
Monthly
MACD
Bearish
Bearish
RSI
No Signal
No Signal
Bollinger Bands
Bearish
Bearish
Moving Averages
Bearish (Daily)
KST
Bearish
Bearish
Dow Theory
Mildly Bearish
Mildly Bearish
stock-summary Technical Indicator Scale: Bearish, Mildly Bearish, Sideways, Mildly Bullish, Bullish  Turned 
stock-summaryShareholding
Shareholding Snapshot : Sep 2025stock-summary
Shareholding Compare (%holding) stock-summary
Majority shareholders

Non Institution

Pledged Promoter Holdings

None

Mutual Funds

Held by 0 Schemes

FIIs

Held by 0 FIIs

Promoter with highest holding

Kumar V Shah (9.4%)

Highest Public shareholder

Solfic Infotech Private Limited (19.24%)

Individual Investors Holdings

60.23%

stock-summaryFinancial
[
  {
    "link": "quarterly",
    "btn_text": "All Quarterly Results",
    "header": "Quarterly Results Snapshot (Standalone) - Sep'25 - QoQ",
    "rhs": [
      {
        "prefix": "Net Sales ",
        "suffix": "QoQ Growth in quarter ended Sep 2025 is 24.39% vs -60.19% in Jun 2025",
        "dir": 1
      },
      {
        "prefix": "Standalone Net Profit ",
        "suffix": "QoQ Growth in quarter ended Sep 2025 is 0.00% vs 100.00% in Jun 2025",
        "dir": -1
      }
    ],
    "table": {
      "header": [
        "Sep'25",
        "Jun'25",
        "Change(%)"
      ],
      "body": [
        {
          "field": "Net Sales",
          "val1": "0.51",
          "val2": "0.41",
          "chgp": "24.39%",
          "chgp_class": "positive"
        },
        {
          "field": "Operating Profit (PBDIT) excl Other Income",
          "val1": "0.01",
          "val2": "0.01",
          "chgp": "",
          "chgp_class": "neutral"
        },
        {
          "field": "Interest",
          "val1": "0.00",
          "val2": "0.00",
          "chgp": "",
          "chgp_class": "neutral"
        },
        {
          "field": "Exceptional Items",
          "val1": "0.00",
          "val2": "0.00",
          "chgp": "",
          "chgp_class": "neutral"
        },
        {
          "field": "Standalone Net Profit",
          "val1": "0.00",
          "val2": "0.00",
          "chgp": "",
          "chgp_class": "neutral"
        },
        {
          "field": "Operating Profit Margin (Excl OI)",
          "val1": "1.96%",
          "val2": "2.44%",
          "chgp": "-0.48%",
          "chgp_class": "negative"
        }
      ]
    }
  },
  {
    "link": "half-yearly",
    "btn_text": "All Half Yearly Results",
    "header": "Half Yearly Results Snapshot (Standalone) - Sep'25",
    "rhs": [
      {
        "prefix": "Net Sales ",
        "suffix": " Growth in half year ended Sep 2025 is -58.45% vs -84.15% in Sep 2024",
        "dir": 1
      },
      {
        "prefix": "Standalone Net Profit ",
        "suffix": " Growth in half year ended Sep 2025 is -100.00% vs -98.95% in Sep 2024",
        "dir": -1
      }
    ],
    "table": {
      "header": [
        "Sep'25",
        "Sep'24",
        "Change(%)"
      ],
      "body": [
        {
          "field": "Net Sales",
          "val1": "0.91",
          "val2": "2.19",
          "chgp": "-58.45%",
          "chgp_class": "negative"
        },
        {
          "field": "Operating Profit (PBDIT) excl Other Income",
          "val1": "0.00",
          "val2": "0.01",
          "chgp": "-100.00%",
          "chgp_class": "negative"
        },
        {
          "field": "Interest",
          "val1": "0.00",
          "val2": "0.00",
          "chgp": "",
          "chgp_class": "neutral"
        },
        {
          "field": "Exceptional Items",
          "val1": "0.00",
          "val2": "0.00",
          "chgp": "",
          "chgp_class": "neutral"
        },
        {
          "field": "Standalone Net Profit",
          "val1": "0.00",
          "val2": "0.01",
          "chgp": "-100.00%",
          "chgp_class": "negative"
        },
        {
          "field": "Operating Profit Margin (Excl OI)",
          "val1": "0.00%",
          "val2": "0.46%",
          "chgp": "-0.46%",
          "chgp_class": "negative"
        }
      ]
    }
  },
  {
    "link": "nine-monthly",
    "btn_text": "All Nine Monthly Results",
    "header": "Nine Monthly Results Snapshot (Standalone) - Dec'24",
    "rhs": [
      {
        "prefix": "Net Sales ",
        "suffix": "YoY Growth in nine months ended Dec 2024 is -79.48% vs 301.16% in Dec 2023",
        "dir": -1
      },
      {
        "prefix": "Standalone Net Profit ",
        "suffix": "YoY Growth in nine months ended Dec 2024 is -94.95% vs 400.00% in Dec 2023",
        "dir": -1
      }
    ],
    "table": {
      "header": [
        "Dec'24",
        "Dec'23",
        "Change(%)"
      ],
      "body": [
        {
          "field": "Net Sales",
          "val1": "3.54",
          "val2": "17.25",
          "chgp": "-79.48%",
          "chgp_class": "negative"
        },
        {
          "field": "Operating Profit (PBDIT) excl Other Income",
          "val1": "0.06",
          "val2": "1.33",
          "chgp": "-95.49%",
          "chgp_class": "negative"
        },
        {
          "field": "Interest",
          "val1": "0.00",
          "val2": "0.00",
          "chgp": "",
          "chgp_class": "neutral"
        },
        {
          "field": "Exceptional Items",
          "val1": "0.00",
          "val2": "0.00",
          "chgp": "",
          "chgp_class": "neutral"
        },
        {
          "field": "Standalone Net Profit",
          "val1": "0.05",
          "val2": "0.99",
          "chgp": "-94.95%",
          "chgp_class": "negative"
        },
        {
          "field": "Operating Profit Margin (Excl OI)",
          "val1": "1.69%",
          "val2": "7.71%",
          "chgp": "-6.02%",
          "chgp_class": "negative"
        }
      ]
    }
  },
  {
    "link": "annual",
    "btn_text": "All Annual Results",
    "header": "Annual Results Snapshot (Standalone) - Mar'25",
    "rhs": [
      {
        "prefix": "Net Sales ",
        "suffix": "YoY Growth in year ended Mar 2025 is -77.37% vs 162.18% in Mar 2024",
        "dir": -1
      },
      {
        "prefix": "Standalone Net Profit ",
        "suffix": "YoY Growth in year ended Mar 2025 is -66.67% vs -76.00% in Mar 2024",
        "dir": 1
      }
    ],
    "table": {
      "header": [
        "Mar'25",
        "Mar'24",
        "Change(%)"
      ],
      "body": [
        {
          "field": "Net Sales",
          "val1": "4.58",
          "val2": "20.24",
          "chgp": "-77.37%",
          "chgp_class": "negative"
        },
        {
          "field": "Operating Profit (PBDIT) excl Other Income",
          "val1": "0.01",
          "val2": "0.16",
          "chgp": "-93.75%",
          "chgp_class": "negative"
        },
        {
          "field": "Interest",
          "val1": "0.00",
          "val2": "0.00",
          "chgp": "",
          "chgp_class": "neutral"
        },
        {
          "field": "Exceptional Items",
          "val1": "0.04",
          "val2": "0.00",
          "chgp": "",
          "chgp_class": "neutral"
        },
        {
          "field": "Standalone Net Profit",
          "val1": "0.04",
          "val2": "0.12",
          "chgp": "-66.67%",
          "chgp_class": "negative"
        },
        {
          "field": "Operating Profit Margin (Excl OI)",
          "val1": "0.22%",
          "val2": "0.79%",
          "chgp": "-0.57%",
          "chgp_class": "negative"
        }
      ]
    }
  }
]

Quarterly Results Snapshot (Standalone) - Sep'25 - QoQstock-summary

Sep'25
Jun'25
Change(%)
Net Sales
0.51
0.41
24.39%
Operating Profit (PBDIT) excl Other Income
0.01
0.01
Interest
0.00
0.00
Exceptional Items
0.00
0.00
Standalone Net Profit
0.00
0.00
Operating Profit Margin (Excl OI)
1.96%
2.44%
-0.48%
Values in Rs Cr.
Direction Arrows
Net Sales

QoQ Growth in quarter ended Sep 2025 is 24.39% vs -60.19% in Jun 2025

Direction Arrows
Standalone Net Profit

QoQ Growth in quarter ended Sep 2025 is 0.00% vs 100.00% in Jun 2025

Half Yearly Results Snapshot (Standalone) - Sep'25stock-summary

Sep'25
Sep'24
Change(%)
Net Sales
0.91
2.19
-58.45%
Operating Profit (PBDIT) excl Other Income
0.00
0.01
-100.00%
Interest
0.00
0.00
Exceptional Items
0.00
0.00
Standalone Net Profit
0.00
0.01
-100.00%
Operating Profit Margin (Excl OI)
0.00%
0.46%
-0.46%
Values in Rs Cr.
Direction Arrows
Net Sales

Growth in half year ended Sep 2025 is -58.45% vs -84.15% in Sep 2024

Direction Arrows
Standalone Net Profit

Growth in half year ended Sep 2025 is -100.00% vs -98.95% in Sep 2024

Nine Monthly Results Snapshot (Standalone) - Dec'24stock-summary

Dec'24
Dec'23
Change(%)
Net Sales
3.54
17.25
-79.48%
Operating Profit (PBDIT) excl Other Income
0.06
1.33
-95.49%
Interest
0.00
0.00
Exceptional Items
0.00
0.00
Standalone Net Profit
0.05
0.99
-94.95%
Operating Profit Margin (Excl OI)
1.69%
7.71%
-6.02%
Values in Rs Cr.
Direction Arrows
Net Sales

YoY Growth in nine months ended Dec 2024 is -79.48% vs 301.16% in Dec 2023

Direction Arrows
Standalone Net Profit

YoY Growth in nine months ended Dec 2024 is -94.95% vs 400.00% in Dec 2023

Annual Results Snapshot (Standalone) - Mar'25stock-summary

Mar'25
Mar'24
Change(%)
Net Sales
4.58
20.24
-77.37%
Operating Profit (PBDIT) excl Other Income
0.01
0.16
-93.75%
Interest
0.00
0.00
Exceptional Items
0.04
0.00
Standalone Net Profit
0.04
0.12
-66.67%
Operating Profit Margin (Excl OI)
0.22%
0.79%
-0.57%
Values in Rs Cr.
Direction Arrows
Net Sales

YoY Growth in year ended Mar 2025 is -77.37% vs 162.18% in Mar 2024

Direction Arrows
Standalone Net Profit

YoY Growth in year ended Mar 2025 is -66.67% vs -76.00% in Mar 2024

stock-summaryCompany CV
About Mitshi India Ltd stock-summary
stock-summary
Mitshi India Ltd
Micro Cap
Trading & Distributors
Mitshi India Limited (formerly known as Dera Paints and Chemicals Ltd) was incorporated on July 23, 1990. The name of the Company was changed from Dera Paints and Chemicals Limited to Mitshi India Limited in February, 2016. Till then, the Company was in the field of manufacturing automotive, industrial and decorative paints, thinners & synthetic resins with trading of industrial solvents and other raw materials to concern and allied industry.
Company Coordinates stock-summary
Company Details
2 Juhu Aradhana CHS Ltd, Juhu Lane Mumbai Maharashtra : 400058
stock-summary
Tel: 91-022-26481711
stock-summary
derapaints@gmail.com
Registrar Details
Adroit Corporate Services Pvt Ltd, 17-20 Jaferbhoy Industrial Estate , 1st Floor, Makwana Road, Marol Naka, Mumbai