
Compare Atishay with Similar Stocks
Stock DNA
Software Products
INR 231 Cr (Micro Cap)
32.00
20
0.48%
-0.03
12.96%
4.19
Total Returns (Price + Dividend) 
Latest dividend: 1 per share ex-dividend date: May-19-2026
Risk Adjusted Returns v/s
Returns Beta

News

Atishay Ltd is Rated Hold by MarketsMOJO
Atishay Ltd is rated 'Hold' by MarketsMOJO, with this rating last updated on 08 June 2026. However, the analysis and financial metrics discussed here reflect the stock's current position as of 23 June 2026, providing investors with an up-to-date view of the company’s performance and outlook.
Read full news article
Atishay Ltd Upgraded to Hold by MarketsMOJO Amid Mixed Technical and Financial Signals
Atishay Ltd, a micro-cap player in the Software Products sector, has seen its investment rating upgraded from Sell to Hold as of 8 June 2026. This change reflects a nuanced improvement across technical indicators, valuation metrics, financial trends, and overall quality assessments, signalling a cautious but more optimistic outlook for investors.
Read full news article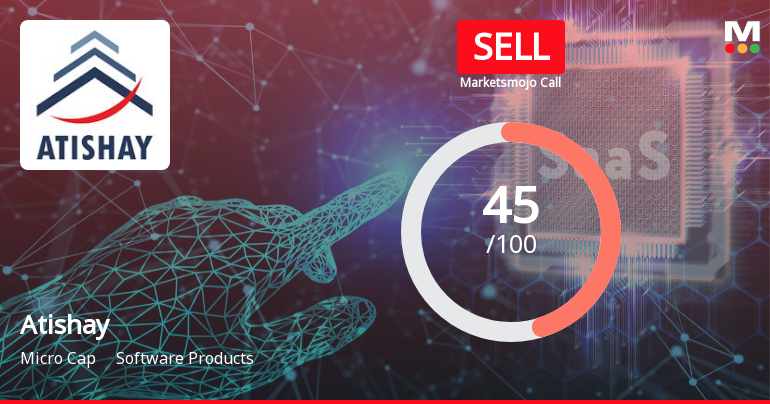
Atishay Ltd Downgraded to Sell Amid Flat Financials and Technical Weakness
Atishay Ltd, a micro-cap player in the Software Products sector, has seen its investment rating downgraded from Hold to Sell as of 1 June 2026. This shift reflects a combination of deteriorating technical indicators, flat recent financial performance, and valuation concerns despite the company’s consistent long-term returns and net debt-free status.
Read full news article Announcements
Announcement under Regulation 30 (LODR)-Resignation of Company Secretary / Compliance Officer
15-Jun-2026 | Source : BSEIntimation regarding resignation of the Company Secretary and Compliance officer of the Company. For more details kindly refer the announcement.
Announcement under Regulation 30 (LODR)-Award_of_Order_Receipt_of_Order
13-Jun-2026 | Source : BSEThe Company has been awarded Work Order related to the Printing and delivery of AB PM -JAY Cards and AB VAY Vandana Cards for eight (8) districts in the state of West Bengal by the Government of West Bengal under Ayushman Bharat-Pradhan Mantri Jan Arogya Yojana Order value Rs. 11.16 Crores . For more details kindly refer the announcement.
Announcement under Regulation 30 (LODR)-Award_of_Order_Receipt_of_Order
31-May-2026 | Source : BSEThe Company as prime bidder in consortium with M/s. Gundal Business Private Limited has been awarded Rate contract work order by the State Election Commission Karnataka (Authority) for Printing of State Voter Identity Cards (SVIC) and other enclosures for the State Election commision Karnataka.
Corporate Actions

No Upcoming Board Meetings

Atishay Ltd has declared 10% dividend, ex-date: 19 May 26

No Splits history available

Atishay Ltd has announced 1:4 bonus issue, ex-date: 14 Sep 16

No Rights history available
Quality key factors
Valuation key factors
Technicals key factors
 Technical Indicator Scale: Bearish, Mildly Bearish, Sideways, Mildly Bullish, Bullish Turned
 Shareholding Snapshot : Mar 2026
Shareholding Compare (%holding)
Promoters
None
Held by 0 Schemes
Held by 0 FIIs
Akhilesh Jain (31.92%)
None
20.05%
Quarterly Results Snapshot (Standalone) - Mar'26 - YoY

YoY Growth in quarter ended Mar 2026 is -20.79% vs -26.50% in Mar 2025

YoY Growth in quarter ended Mar 2026 is -25.00% vs -6.72% in Mar 2025
Half Yearly Results Snapshot (Standalone) - Sep'25
Growth in half year ended Sep 2025 is 30.68% vs 64.62% in Sep 2024
Growth in half year ended Sep 2025 is 37.55% vs 121.93% in Sep 2024
Nine Monthly Results Snapshot (Standalone) - Dec'25
YoY Growth in nine months ended Dec 2025 is 19.09% vs 48.56% in Dec 2024
YoY Growth in nine months ended Dec 2025 is 15.73% vs 53.14% in Dec 2024
Annual Results Snapshot (Standalone) - Mar'26
YoY Growth in year ended Mar 2026 is 9.03% vs 18.24% in Mar 2025
YoY Growth in year ended Mar 2026 is 1.85% vs 26.31% in Mar 2025
About Atishay Ltd

Company Coordinates


