
Compare Virinchi with Similar Stocks
Dashboard
Weak Long Term Fundamental Strength with a -28.39% CAGR growth in Operating Profits over the last 5 years
- Low ability to service debt as the company has a high Debt to EBITDA ratio of 4.24 times
- The company has been able to generate a Return on Equity (avg) of 2.06% signifying low profitability per unit of shareholders funds
The company declared negative results in Mar'26 after flat results in Dec'25
Consistent Underperformance against the benchmark over the last 3 years
Stock DNA
Software Products
INR 179 Cr (Micro Cap)
NA (Loss Making)
20
0.00%
0.54
-5.30%
0.37
Total Returns (Price + Dividend) 
Latest dividend: 0.25 per share ex-dividend date: Sep-17-2012
Risk Adjusted Returns v/s
Returns Beta

News

Virinchi Ltd is Rated Strong Sell
Virinchi Ltd is rated Strong Sell by MarketsMOJO, with this rating last updated on 29 May 2026. However, the analysis and financial metrics discussed here reflect the company’s current position as of 05 July 2026, providing investors with the latest insights into its performance and outlook.
Read full news article
Virinchi Ltd is Rated Strong Sell
Virinchi Ltd is rated Strong Sell by MarketsMOJO, with this rating last updated on 29 May 2026. However, the analysis and financial metrics discussed below reflect the stock's current position as of 23 June 2026, providing investors with the latest insights into the company’s performance and outlook.
Read full news article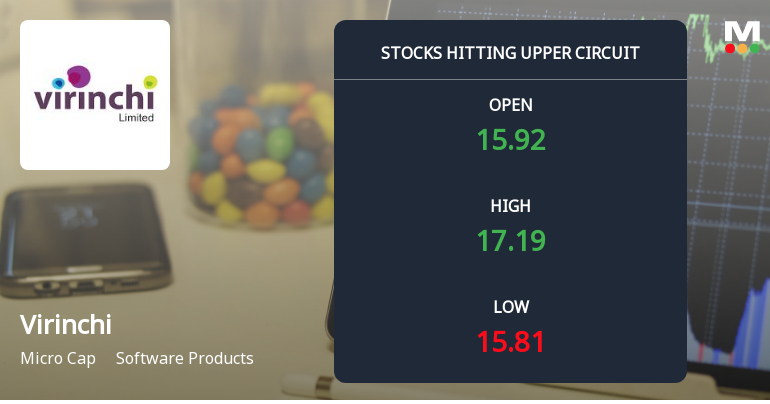
Virinchi Ltd Locks at Upper Circuit With 8.56% Gain — Buyers Queue, Sellers Absent
At Rs 17.00, the buying was done — not because demand dried up, but because the exchange wouldn't let the stock go any higher. Virinchi Ltd locked at its upper circuit of 8.56% on 16 Jun 2026, with buyers queuing and no sellers willing to part with shares.
Read full news article Announcements
Corporate Actions

No Upcoming Board Meetings

Virinchi Ltd has declared 5% dividend, ex-date: 17 Sep 12

No Splits history available

Virinchi Ltd has announced 1:1 bonus issue, ex-date: 21 Mar 22

No Rights history available
Quality key factors
Valuation key factors
Technicals key factors
 Technical Indicator Scale: Bearish, Mildly Bearish, Sideways, Mildly Bullish, Bullish Turned
 Shareholding Snapshot : Jun 2026
Shareholding Compare (%holding)
Non Institution
17.2364
Held by 0 Schemes
Held by 1 FIIs (0.04%)
Viswanath Kompella (14.53%)
Green Field Meadows Infra Private Limited (2.36%)
48.74%
Quarterly Results Snapshot (Consolidated) - Mar'26 - QoQ

QoQ Growth in quarter ended Mar 2026 is -14.20% vs 24.48% in Dec 2025
QoQ Growth in quarter ended Mar 2026 is -980.12% vs 112.21% in Dec 2025
Half Yearly Results Snapshot (Consolidated) - Sep'25
Growth in half year ended Sep 2025 is -5.53% vs -1.98% in Sep 2024
Growth in half year ended Sep 2025 is -1,082.84% vs -77.63% in Sep 2024
Nine Monthly Results Snapshot (Consolidated) - Dec'25
YoY Growth in nine months ended Dec 2025 is -5.94% vs 3.03% in Dec 2024
YoY Growth in nine months ended Dec 2025 is -325.24% vs -55.99% in Dec 2024
Annual Results Snapshot (Consolidated) - Mar'26
YoY Growth in year ended Mar 2026 is -5.57% vs 0.37% in Mar 2025
YoY Growth in year ended Mar 2026 is -3,727.78% vs -94.74% in Mar 2025
About Virinchi Ltd

Company Coordinates


