
Compare Voltas with Similar Stocks
Stock DNA
Electronics & Appliances
INR 44,024 Cr (Mid Cap)
111.00
88
0.30%
-0.01
6.20%
7.01
Total Returns (Price + Dividend) 
Latest dividend: 4.009670878178131 per share ex-dividend date: Jun-12-2026
Risk Adjusted Returns v/s
Returns Beta

News
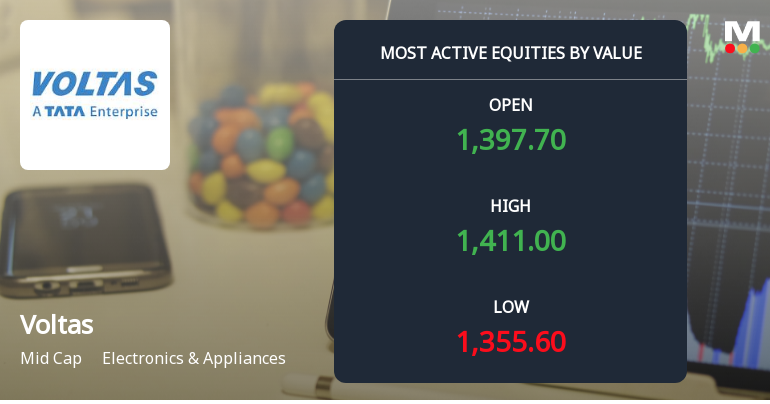
Voltas Ltd. Sees High-Value Trading Amid Strong Market Outperformance
Voltas Ltd., a prominent player in the Electronics & Appliances sector, emerged as one of the most actively traded stocks by value on 22 June 2026, reflecting heightened investor interest and robust market momentum. The mid-cap company witnessed a significant surge in its share price and trading volumes, outperforming both its sector and the broader Sensex index.
Read full news article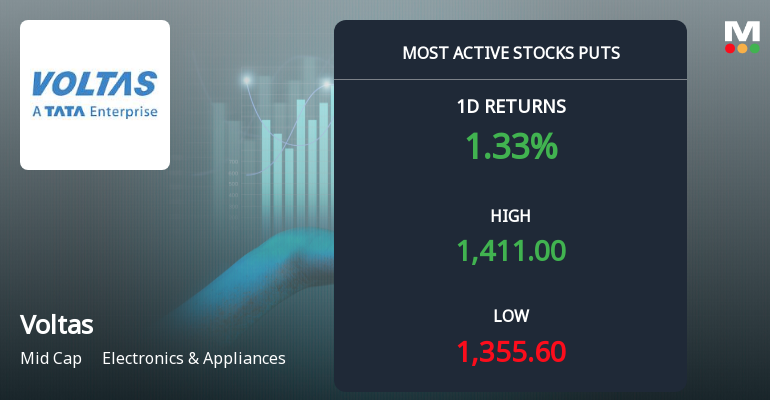
Rs 1,380 Puts Draw 3,159 Contracts on Voltas Ltd. as Stock Holds Above Key Moving Averages
The stock is trading at Rs 1,368.90, just below the Rs 1,380 put strike where 3,159 contracts changed hands on 22 Jun 2026. This activity, combined with the stock’s recent gains and strong technical positioning, suggests a nuanced picture of protective hedging rather than outright bearish conviction for Voltas Ltd..
Read full news article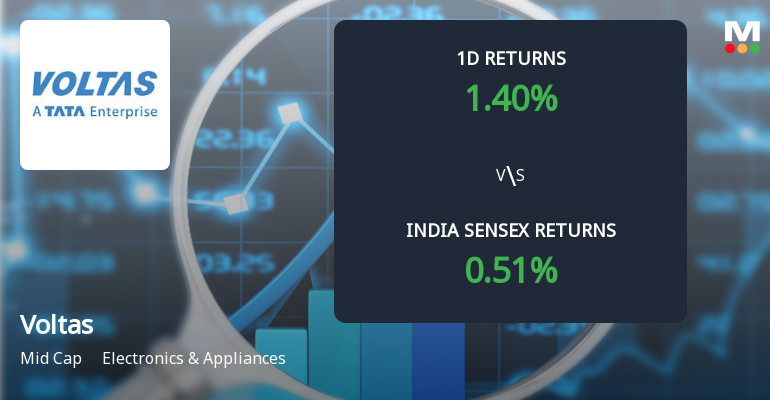
Voltas Ltd. Sees Sharp Open Interest Surge Amid Bullish Market Positioning
Voltas Ltd., a prominent player in the Electronics & Appliances sector, has witnessed a significant surge in open interest (OI) in its derivatives segment, signalling heightened market activity and shifting investor positioning. The stock outperformed its sector peers today, buoyed by a 19.5% jump in open interest and robust volume patterns, suggesting renewed directional bets among traders.
Read full news article Announcements
Press Release -Voltas Crosses 1 Million AC Sales Milestone In FY 26-27.
21-Jun-2026 | Source : BSEPress Release- Voltas crosses 1 Million AC Sales Milestone in FY 26-27.
Announcement under Regulation 30 (LODR)-Change in Management
15-Jun-2026 | Source : BSEAppointment of Senior Management Personnel
Intimation Under Regulation 30 Of SEBI (Listing Obligations And Disclosure Requirements) Regulations 2015 (SEBI Listing Regulations)
10-Jun-2026 | Source : BSEIntimation under Regulation 30 of SEBI Listing Regulations
Corporate Actions

No Upcoming Board Meetings

Voltas Ltd. has declared 400% dividend, ex-date: 12 Jun 26

Voltas Ltd. has announced 1:10 stock split, ex-date: 22 Sep 06

No Bonus history available

No Rights history available
Quality key factors
Valuation key factors
Technicals key factors
 Technical Indicator Scale: Bearish, Mildly Bearish, Sideways, Mildly Bullish, Bullish Turned
 Shareholding Snapshot : Mar 2026
Shareholding Compare (%holding)
Promoters
None
Held by 31 Schemes (14.7%)
Held by 539 FIIs (18.45%)
Tata Sons Private Limited (26.64%)
Life Insurance Corporation Of India (7.97%)
10.15%
Quarterly Results Snapshot (Consolidated) - Mar'26 - QoQ

QoQ Growth in quarter ended Mar 2026 is 59.17% vs 30.82% in Dec 2025

QoQ Growth in quarter ended Mar 2026 is 36.76% vs 147.74% in Dec 2025
Half Yearly Results Snapshot (Consolidated) - Sep'25
Growth in half year ended Sep 2025 is -16.63% vs 33.39% in Sep 2024
Growth in half year ended Sep 2025 is -62.68% vs 182.11% in Sep 2024
Nine Monthly Results Snapshot (Consolidated) - Dec'25
YoY Growth in nine months ended Dec 2025 is -12.10% vs 28.59% in Dec 2024
YoY Growth in nine months ended Dec 2025 is -56.74% vs 342.87% in Dec 2024
Annual Results Snapshot (Consolidated) - Mar'26
YoY Growth in year ended Mar 2026 is -7.58% vs 23.49% in Mar 2025
YoY Growth in year ended Mar 2026 is -55.33% vs 233.88% in Mar 2025
About Voltas Ltd.

Company Coordinates


