
Compare Peninsula Land with Similar Stocks
Dashboard
High Debt company with Weak Long Term Fundamental Strength
- Poor long term growth as Net Sales has grown by an annual rate of -11.50% over the last 5 years
- High Debt Company with a Debt to Equity ratio (avg) of 7.30 times
The company has declared Negative results for the last 9 consecutive quarters
With ROCE of 1.5, it has a Expensive valuation with a 2.3 Enterprise value to Capital Employed
Despite the size of the company, domestic mutual funds hold only 0% of the company
Below par performance in long term as well as near term
Stock DNA
Realty
INR 525 Cr (Micro Cap)
NA (Loss Making)
36
0.00%
3.85
-30.25%
7.36
Total Returns (Price + Dividend) 
Latest dividend: 0.20000000000000004 per share ex-dividend date: Jul-28-2016
Risk Adjusted Returns v/s
Returns Beta

News

Peninsula Land Ltd is Rated Strong Sell
Peninsula Land Ltd is rated Strong Sell by MarketsMOJO, with this rating last updated on 03 Nov 2025. However, the analysis and financial metrics discussed here reflect the stock's current position as of 01 August 2026, providing investors with an up-to-date view of the company’s fundamentals, valuation, financial trends, and technical outlook.
Read full news article
Peninsula Land Ltd Faces Bearish Momentum Amid Technical Downturn
Peninsula Land Ltd, a micro-cap player in the realty sector, has experienced a notable shift in its technical momentum, with key indicators signalling a bearish trend. Despite a modest recovery in monthly MACD readings, the overall technical landscape points to deteriorating price strength, reflected in a recent downgrade to a Strong Sell rating by MarketsMOJO.
Read full news article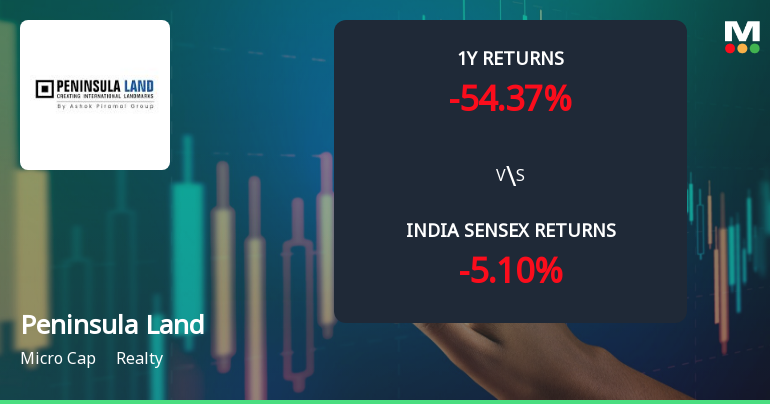
Peninsula Land Ltd Technical Momentum Shifts Amid Bearish Market Sentiment
Peninsula Land Ltd, a micro-cap player in the realty sector, has experienced a subtle shift in its technical momentum, moving from a bearish to a mildly bearish stance. Despite a modest intraday gain of 1.99% to close at ₹16.40 on 29 Jul 2026, the stock remains under pressure with a strong sell rating and deteriorating long-term returns compared to the broader Sensex.
Read full news article Announcements
Board Meeting Outcome for Outcome Of 02/2026-27 Board Meeting Held On July 14 2026 For Approval Of Material Related Party Transaction(S)
14-Jul-2026 | Source : BSEOutcome of 02/2026-27 Board Meeting held on July 14 2026 for approval of material Related Party Transaction(s)
Compliances-Certificate under Reg. 74 (5) of SEBI (DP) Regulations 2018
02-Jul-2026 | Source : BSEDear Sir/Madam Pursuant to Regulation 74(5) of the Securities and Exchange Board of India (Depositories and Participants) Regulations 2018 please find enclosed herewith a confirmation certificate received from Purva Sharegistry (I) Private Limited the Registrar and Transfer Agent of the Company for quarter ended June 30 2026. Please take the above on record.
Announcement under Regulation 30 (LODR)-Credit Rating
01-Jul-2026 | Source : BSEIntimation under Regulation 30 of the Securities and Exchange Board of India (Listing Obligations and Disclosure Requirements) Regulations 2015
Corporate Actions

No Upcoming Board Meetings

Peninsula Land Ltd has declared 10% dividend, ex-date: 28 Jul 16

Peninsula Land Ltd has announced 2:10 stock split, ex-date: 16 Oct 07

No Bonus history available

No Rights history available
Quality key factors
Valuation key factors
Technicals key factors
 Technical Indicator Scale: Bearish, Mildly Bearish, Sideways, Mildly Bullish, Bullish Turned
 Shareholding Snapshot : Jun 2026
Shareholding Compare (%holding)
Promoters
None
Held by 1 Schemes (0.0%)
Held by 4 FIIs (0.03%)
Urvi Ashok Piramal (36.27%)
None
24.5%
Quarterly Results Snapshot (Consolidated) - Mar'26 - QoQ

QoQ Growth in quarter ended Mar 2026 is 49.80% vs -27.36% in Dec 2025

QoQ Growth in quarter ended Mar 2026 is -892.03% vs 35.57% in Dec 2025
Half Yearly Results Snapshot (Consolidated) - Sep'25
Growth in half year ended Sep 2025 is -20.36% vs -70.18% in Sep 2024
Growth in half year ended Sep 2025 is -1,522.42% vs -97.71% in Sep 2024
Nine Monthly Results Snapshot (Consolidated) - Dec'25
YoY Growth in nine months ended Dec 2025 is -47.43% vs -57.55% in Dec 2024
YoY Growth in nine months ended Dec 2025 is -358.42% vs -107.40% in Dec 2024
Annual Results Snapshot (Consolidated) - Mar'26
YoY Growth in year ended Mar 2026 is -44.44% vs -54.94% in Mar 2025
YoY Growth in year ended Mar 2026 is -326.78% vs -127.95% in Mar 2025
About Peninsula Land Ltd

Company Coordinates


