
Compare Peninsula Land with Similar Stocks
Dashboard
High Debt company with Weak Long Term Fundamental Strength
- Poor long term growth as Net Sales has grown by an annual rate of -11.50% over the last 5 years
- High Debt Company with a Debt to Equity ratio (avg) of 7.30 times
The company has declared Negative results for the last 9 consecutive quarters
With ROCE of 1.5, it has a Expensive valuation with a 2.3 Enterprise value to Capital Employed
Despite the size of the company, domestic mutual funds hold only 0% of the company
Below par performance in long term as well as near term
Stock DNA
Realty
INR 548 Cr (Micro Cap)
NA (Loss Making)
35
0.00%
3.85
-30.25%
7.53
Total Returns (Price + Dividend) 
Latest dividend: 0.20000000000000004 per share ex-dividend date: Jul-28-2016
Risk Adjusted Returns v/s
Returns Beta

News
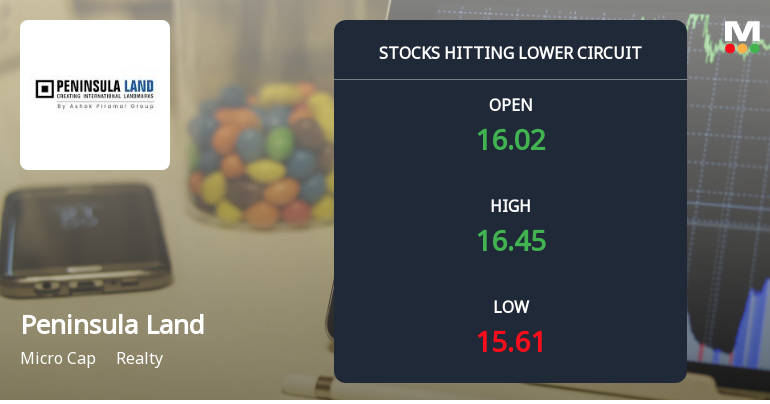
Peninsula Land Ltd Locks at Lower Circuit With 1.42% Loss — Sellers Queue, No Buyers in Sight
At Rs 15.44, sellers were still queuing — but there were no buyers willing to take the other side. Peninsula Land Ltd locked at its lower circuit of 5% on 22 Jun 2026, with unfilled sell orders and a frozen price, signalling persistent selling pressure in a micro-cap environment.
Read full news article
Peninsula Land Ltd is Rated Strong Sell
Peninsula Land Ltd is rated Strong Sell by MarketsMOJO, with this rating last updated on 03 Nov 2025. However, the analysis and financial metrics presented here reflect the stock’s current position as of 15 June 2026, providing investors with an up-to-date view of the company’s fundamentals, returns, and market standing.
Read full news article
Peninsula Land Ltd is Rated Strong Sell
Peninsula Land Ltd is rated Strong Sell by MarketsMOJO, with this rating last updated on 03 Nov 2025. However, the analysis and financial metrics discussed below reflect the company’s current position as of 04 June 2026, providing investors with an up-to-date view of the stock’s fundamentals, valuation, financial trends, and technical outlook.
Read full news article Announcements
Announcement under Regulation 30 (LODR)-Newspaper Publication
30-May-2026 | Source : BSEDear Sir/Madam Pursuant to Regulations 30 and 47 of the Securities and Exchange Board of India (Listing Obligations and Disclosure Requirements) Regulations 2015 we hereby enclose copies of the newspaper advertisement of the Audited Financial Results for quarter and year ended March 31 2026 as published in the following newspapers: 1. Business Standard - All Editions (English Newspaper) and 2. Mumbai Lakshadeep - Mumbai Edition (Marathi Newspaper).
Appointment Of Internal Auditor
29-May-2026 | Source : BSEAppointment of Internal Auditor
Announcement under Regulation 30 (LODR)-Change in Directorate
29-May-2026 | Source : BSEReappointment of Pawan Swamy as an Independent director and redesignation of Nandan Piramal from WTD to MD designated as Joint MD
Corporate Actions

No Upcoming Board Meetings

Peninsula Land Ltd has declared 10% dividend, ex-date: 28 Jul 16

Peninsula Land Ltd has announced 2:10 stock split, ex-date: 16 Oct 07

No Bonus history available

No Rights history available
Quality key factors
Valuation key factors
Technicals key factors
 Technical Indicator Scale: Bearish, Mildly Bearish, Sideways, Mildly Bullish, Bullish Turned
 Shareholding Snapshot : Mar 2026
Shareholding Compare (%holding)
Promoters
None
Held by 1 Schemes (0.0%)
Held by 5 FIIs (0.14%)
Urvi Ashok Piramal (36.27%)
None
23.88%
Quarterly Results Snapshot (Consolidated) - Mar'26 - QoQ

QoQ Growth in quarter ended Mar 2026 is 49.80% vs -27.36% in Dec 2025

QoQ Growth in quarter ended Mar 2026 is -892.03% vs 35.57% in Dec 2025
Half Yearly Results Snapshot (Consolidated) - Sep'25
Growth in half year ended Sep 2025 is -20.36% vs -70.18% in Sep 2024
Growth in half year ended Sep 2025 is -1,522.42% vs -97.71% in Sep 2024
Nine Monthly Results Snapshot (Consolidated) - Dec'25
YoY Growth in nine months ended Dec 2025 is -47.43% vs -57.55% in Dec 2024
YoY Growth in nine months ended Dec 2025 is -358.42% vs -107.40% in Dec 2024
Annual Results Snapshot (Consolidated) - Mar'26
YoY Growth in year ended Mar 2026 is -44.44% vs -54.94% in Mar 2025
YoY Growth in year ended Mar 2026 is -326.78% vs -127.95% in Mar 2025
About Peninsula Land Ltd

Company Coordinates


