
Compare Neuland Labs. with Similar Stocks
Dashboard
High Management Efficiency with a high ROE of 16.00%
Company has a Debt to Equity ratio (avg) of 0.07 times
Healthy long term growth as Operating profit has grown by an annual rate 35.13%
With a growth in Net Profit of 424.21%, the company declared Very Positive results in Mar 26
High Institutional Holdings at 36.3%
Consistent Returns over the last 3 years
Stock DNA
Pharmaceuticals & Biotechnology
INR 24,181 Cr (Small Cap)
66.00
35
0.06%
-0.03
19.42%
13.00
Total Returns (Price + Dividend) 
Latest dividend: 12 per share ex-dividend date: Jul-18-2025
Risk Adjusted Returns v/s
Returns Beta

News

Neuland Laboratories Ltd is Rated Buy
Neuland Laboratories Ltd is rated 'Buy' by MarketsMOJO, with this rating last updated on 01 June 2026. However, the analysis and financial metrics presented here reflect the stock's current position as of 05 July 2026, providing investors with the most up-to-date view of the company’s fundamentals, returns, and market performance.
Read full news article
Neuland Laboratories Ltd is Rated Buy
Neuland Laboratories Ltd is rated 'Buy' by MarketsMOJO, with this rating last updated on 01 June 2026. However, the analysis and financial metrics presented here reflect the stock's current position as of 24 June 2026, providing investors with the most up-to-date insight into the company’s performance and outlook.
Read full news article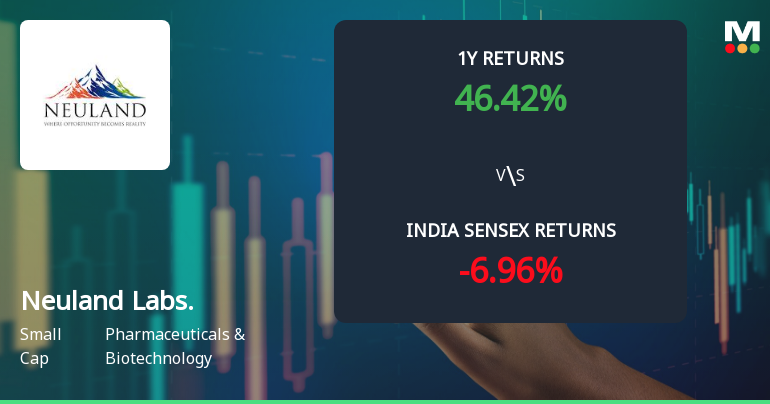
Neuland Laboratories Ltd Sees Bullish Momentum Shift Amid Strong Technical Signals
Neuland Laboratories Ltd has demonstrated a significant shift in price momentum, supported by a series of bullish technical indicators that suggest a strengthening uptrend. The stock’s recent performance, coupled with upgraded technical grades and a robust Mojo Score, positions it favourably within the Pharmaceuticals & Biotechnology sector.
Read full news article Announcements
Compliances-Certificate under Reg. 74 (5) of SEBI (DP) Regulations 2018
02-Jul-2026 | Source : BSECertificate under Reg. 74(5) of SEBI (DP) Regulations 2018
Closure of Trading Window
25-Jun-2026 | Source : BSEClosure of Trading Window
Announcement under Regulation 30 (LODR)-Newspaper Publication
16-Jun-2026 | Source : BSECopy of Newspaper Publication
Corporate Actions

No Upcoming Board Meetings

Neuland Laboratories Ltd has declared 340% dividend, ex-date: 24 Jul 26

No Splits history available

No Bonus history available

Neuland Laboratories Ltd has announced 4:25 rights issue, ex-date: 13 Aug 14
Quality key factors
Valuation key factors
Technicals key factors
 Technical Indicator Scale: Bearish, Mildly Bearish, Sideways, Mildly Bullish, Bullish Turned
 Shareholding Snapshot : Mar 2026
Shareholding Compare (%holding)
Promoters
2.2928
Held by 31 Schemes (11.35%)
Held by 164 FIIs (20.46%)
Davuluri Ownership Trust (dr. Davuluri Ramamohan Rao, Mr. Davuluri Sucheth Rao And Mr. Davuluri Saha (25.98%)
Malabar India Fund Limited (5.65%)
23.84%
Quarterly Results Snapshot (Consolidated) - Mar'26 - QoQ

QoQ Growth in quarter ended Mar 2026 is 76.54% vs -14.50% in Dec 2025
QoQ Growth in quarter ended Mar 2026 is 424.21% vs -58.11% in Dec 2025
Half Yearly Results Snapshot (Consolidated) - Sep'25
Growth in half year ended Sep 2025 is 7.54% vs -3.88% in Sep 2024

Growth in half year ended Sep 2025 is -15.28% vs -13.50% in Sep 2024
Nine Monthly Results Snapshot (Consolidated) - Dec'25
YoY Growth in nine months ended Dec 2025 is 8.56% vs -2.14% in Dec 2024
YoY Growth in nine months ended Dec 2025 is -34.86% vs -0.09% in Dec 2024
Annual Results Snapshot (Consolidated) - Mar'26
YoY Growth in year ended Mar 2026 is 36.98% vs -5.24% in Mar 2025
YoY Growth in year ended Mar 2026 is 39.94% vs -13.32% in Mar 2025
About Neuland Laboratories Ltd

Company Coordinates


