
Compare ERIS Lifescience with Similar Stocks
Dashboard
High Management Efficiency with a high ROCE of 15.33%
Company's ability to service its debt is strong with a healthy EBIT to Interest (avg) ratio of 26.10
Poor long term growth as Operating profit has grown by an annual rate 16.75% of over the last 5 years
Positive results in Mar 26
With ROCE of 13.6, it has a Expensive valuation with a 3.4 Enterprise value to Capital Employed
High Institutional Holdings at 26.75%
Underperformed the market in the last 1 year
Stock DNA
Pharmaceuticals & Biotechnology
INR 19,316 Cr (Small Cap)
30.00
34
0.53%
0.59
16.20%
4.86
Total Returns (Price + Dividend) 
Latest dividend: 7.21 per share ex-dividend date: May-29-2026
Risk Adjusted Returns v/s
Returns Beta

News
ERIS Lifesciences Ltd Upgraded to Hold on Technical and Financial Improvements
ERIS Lifesciences Ltd has seen its investment rating upgraded from Sell to Hold, reflecting a nuanced shift in its technical outlook and valuation metrics. Despite recent price softness, the company’s improving financial trends and stable quality parameters underpin this revised stance, signalling cautious optimism for investors in the Pharmaceuticals & Biotechnology sector.
Read full news article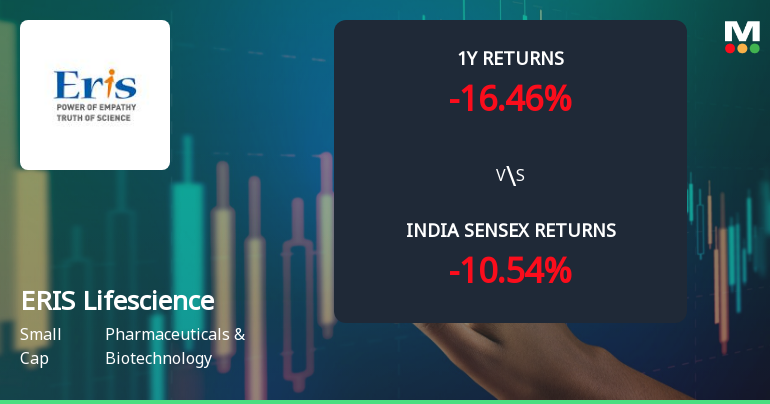
ERIS Lifesciences Ltd Technical Momentum Shifts Amid Mixed Market Signals
ERIS Lifesciences Ltd has experienced a subtle shift in its technical momentum, moving from a bearish to a mildly bearish trend, as reflected in recent indicator readings. Despite a modest day gain of 0.29%, the stock’s technical parameters present a complex picture, with mixed signals from MACD, RSI, moving averages, and other momentum indicators, suggesting cautious investor sentiment amid broader sector challenges.
Read full news article
ERIS Lifesciences Downgraded to Sell Amid Technical Weakness and Valuation Shift
ERIS Lifesciences Ltd, a small-cap player in the Pharmaceuticals & Biotechnology sector, has seen its investment rating downgraded from Hold to Sell as of 5 June 2026. This change reflects a combination of deteriorating technical indicators, a shift in valuation metrics, and mixed financial trends despite recent positive quarterly results. The company’s Mojo Score now stands at 47.0, signalling caution for investors amid a challenging market backdrop.
Read full news article Announcements
Eris Lifesciences Limited - Analysts/Institutional Investor Meet/Con. Call Updates
05-Dec-2019 | Source : NSEEris Lifesciences Limited has informed the Exchange regarding Analysts/Institutional Investor Meet/Con. Call Updates
Eris Lifesciences Limited - Analysts/Institutional Investor Meet/Con. Call Updates
03-Dec-2019 | Source : NSEEris Lifesciences Limited has informed the Exchange regarding Analysts/Institutional Investor Meet/Con. Call Updates
Eris Lifesciences Limited - Analysts/Institutional Investor Meet/Con. Call Updates
28-Nov-2019 | Source : NSEEris Lifesciences Limited has informed the Exchange regarding Analysts/Institutional Investor Meet/Con. Call Updates
Corporate Actions

No Upcoming Board Meetings

ERIS Lifesciences Ltd has declared 721% dividend, ex-date: 29 May 26

No Splits history available

No Bonus history available

No Rights history available
Quality key factors
Valuation key factors
Technicals key factors
 Technical Indicator Scale: Bearish, Mildly Bearish, Sideways, Mildly Bullish, Bullish Turned
 Shareholding Snapshot : Mar 2026
Shareholding Compare (%holding)
Promoters
16.921
Held by 23 Schemes (18.22%)
Held by 127 FIIs (6.39%)
None
Lilac Investments Limited (8.78%)
10.06%
Quarterly Results Snapshot (Consolidated) - Mar'26 - YoY

YoY Growth in quarter ended Mar 2026 is 7.27% vs 28.02% in Mar 2025

YoY Growth in quarter ended Mar 2026 is 200.10% vs 32.11% in Mar 2025
Half Yearly Results Snapshot (Consolidated) - Sep'25
Growth in half year ended Sep 2025 is 7.15% vs 50.31% in Sep 2024
Growth in half year ended Sep 2025 is 36.28% vs -19.94% in Sep 2024
Nine Monthly Results Snapshot (Consolidated) - Dec'25
YoY Growth in nine months ended Dec 2025 is 8.43% vs 50.07% in Dec 2024
YoY Growth in nine months ended Dec 2025 is 30.70% vs -19.47% in Dec 2024
Annual Results Snapshot (Consolidated) - Mar'26
YoY Growth in year ended Mar 2026 is 8.15% vs 44.02% in Mar 2025
YoY Growth in year ended Mar 2026 is 76.08% vs -10.26% in Mar 2025
About ERIS Lifesciences Ltd

Company Coordinates


