
Compare Caplin Point Lab with Similar Stocks
Dashboard
High Management Efficiency with a high ROE of 19.33%
The company is Net-Debt Free
Poor long term growth as Operating profit has grown by an annual rate 18.73% of over the last 5 years
The company has declared Positive results for the last 15 consecutive quarters
With ROE of 17.9, it has a Very Expensive valuation with a 5 Price to Book Value
Majority shareholders : Promoters
Consistent Returns over the last 3 years
Stock DNA
Pharmaceuticals & Biotechnology
INR 18,343 Cr (Small Cap)
28.00
34
0.30%
-0.28
17.88%
4.96
Total Returns (Price + Dividend) 
Latest dividend: 4 per share ex-dividend date: May-29-2026
Risk Adjusted Returns v/s
Returns Beta

News
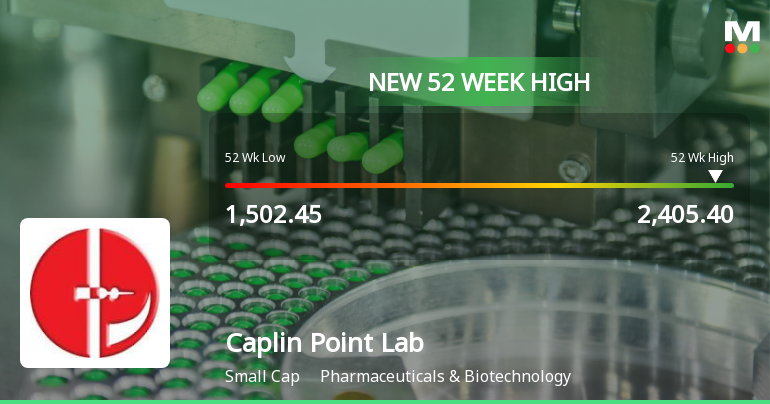
Broad-Based Technical Strength Lifts Caplin Point Laboratories Ltd to 52-Week High of Rs 2405.4
With a decisive surge to Rs 2405.4 on 10 Jun 2026, Caplin Point Laboratories Ltd has reached a fresh 52-week high, propelled by a confluence of bullish technical indicators and sustained price momentum over the past week.
Read full news article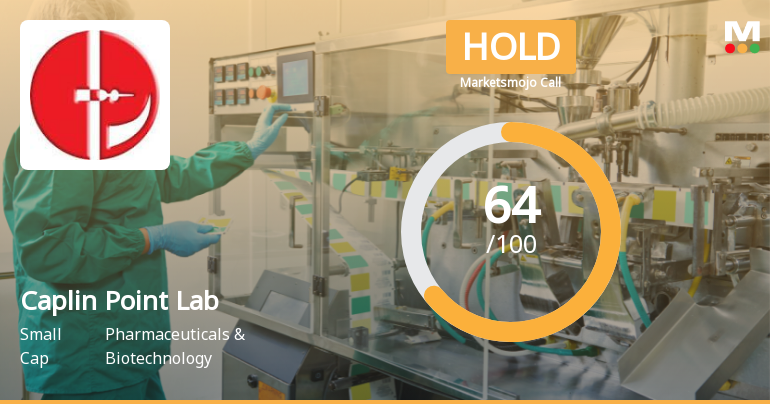
Caplin Point Laboratories Ltd Upgraded to Hold on Technical and Financial Improvements
Caplin Point Laboratories Ltd has seen its investment rating upgraded from Sell to Hold, reflecting a notable improvement in technical indicators and sustained financial performance. The upgrade, effective from 09 June 2026, is driven by enhanced technical trends, solid financial results, stable quality metrics, and a valuation that balances growth prospects with market realities.
Read full news article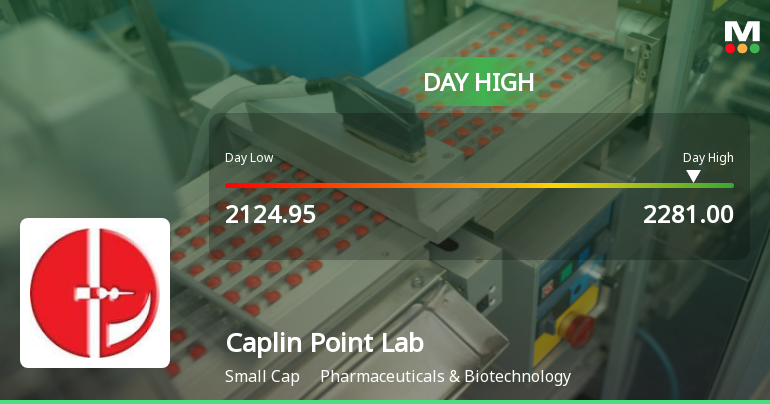
Caplin Point Laboratories Ltd Surges 7.52% to Day's High of Rs 2281 — Outperforms Sector by 6.72 Percentage Points
The Sensex edged up 0.54% on 09 Jun 2026, but Caplin Point Laboratories Ltd outpaced the broader market with a 7.52% gain, reaching an intraday high of Rs 2281. This 6.72 percentage-point outperformance over the Pharmaceuticals & Biotechnology sector highlights a distinctly stock-specific rally rather than a market-wide lift.
Read full news article Announcements
Caplin Point Laboratories Limited - Press Release
03-Dec-2019 | Source : NSECaplin Point Laboratories Limited has informed the Exchange regarding a press release dated December 03, 2019, titled "CAPLIN STERILES GETS USFDA APPROVAL FOR SODIUM NITROPRUSSIDE INJECTION".
Caplin Point Laboratories Limited - Updates
22-Nov-2019 | Source : NSECaplin Point Laboratories Limited has informed the Exchange regarding 'Notice of Postal Ballot'.
Caplin Point Laboratories Limited - Reappointment
31-Oct-2019 | Source : NSECaplin Point Laboratories Limited has informed the Exchange regarding Reappointment of Director of the company.
Corporate Actions

No Upcoming Board Meetings

Caplin Point Laboratories Ltd has declared 200% dividend, ex-date: 29 May 26

Caplin Point Laboratories Ltd has announced 2:10 stock split, ex-date: 19 Oct 16

No Bonus history available

No Rights history available
Quality key factors
Valuation key factors
Technicals key factors
 Technical Indicator Scale: Bearish, Mildly Bearish, Sideways, Mildly Bullish, Bullish Turned
 Shareholding Snapshot : Mar 2026
Shareholding Compare (%holding)
Promoters
None
Held by 17 Schemes (2.02%)
Held by 134 FIIs (6.15%)
P Vijayalakshmi (24.71%)
Uti Multi Cap Fund (1.85%)
14.46%
Quarterly Results Snapshot (Consolidated) - Mar'26 - YoY

YoY Growth in quarter ended Mar 2026 is 19.45% vs 10.86% in Mar 2025
YoY Growth in quarter ended Mar 2026 is 19.32% vs 17.25% in Mar 2025
Half Yearly Results Snapshot (Consolidated) - Sep'25

Growth in half year ended Sep 2025 is 10.85% vs 16.97% in Sep 2024
Growth in half year ended Sep 2025 is 20.60% vs 16.71% in Sep 2024
Nine Monthly Results Snapshot (Consolidated) - Dec'25
YoY Growth in nine months ended Dec 2025 is 10.59% vs 15.65% in Dec 2024
YoY Growth in nine months ended Dec 2025 is 19.66% vs 17.36% in Dec 2024
Annual Results Snapshot (Consolidated) - Mar'26
YoY Growth in year ended Mar 2026 is 12.89% vs 14.37% in Mar 2025
YoY Growth in year ended Mar 2026 is 19.57% vs 17.33% in Mar 2025
About Caplin Point Laboratories Ltd

Company Coordinates


