
Compare OneSource Speci. with Similar Stocks
Dashboard
Poor Management Efficiency with a low ROE of 0.80%
- The company has been able to generate a Return on Equity (avg) of 0.80% signifying low profitability per unit of shareholders funds
Company's ability to service its debt is weak with a poor EBIT to Interest (avg) ratio of 0.68
Healthy long term growth as Net Sales has grown by an annual rate of 185.90% and Operating profit at 67.54%
Flat results in Mar 26
With ROCE of 0.3, it has a Very Expensive valuation with a 2.8 Enterprise value to Capital Employed
38.38% of Promoter Shares are Pledged
Stock DNA
Pharmaceuticals & Biotechnology
INR 18,371 Cr (Small Cap)
NA (Loss Making)
34
0.00%
0.24
-1.10%
3.23
Total Returns (Price + Dividend) 
OneSource Speci. for the last several years.
Risk Adjusted Returns v/s
Returns Beta

News

OneSource Specialty Pharma Ltd is Rated Hold
OneSource Specialty Pharma Ltd is rated 'Hold' by MarketsMOJO, with this rating last updated on 04 June 2026. However, the analysis and financial metrics discussed here reflect the stock's current position as of 08 June 2026, providing investors with the latest insights into the company’s performance and outlook.
Read full news article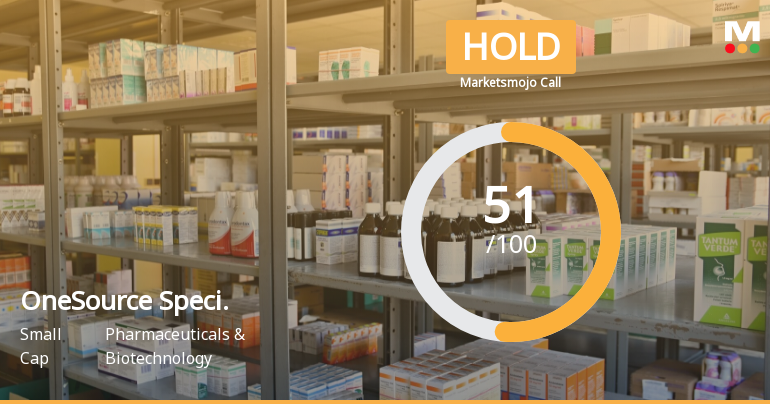
OneSource Specialty Pharma Ltd is Rated Hold
OneSource Specialty Pharma Ltd is rated 'Hold' by MarketsMOJO, with this rating last updated on 04 June 2026. However, the analysis and financial metrics discussed below reflect the stock's current position as of 08 June 2026, providing investors with an up-to-date view of the company’s fundamentals, valuation, financial trends, and technical outlook.
Read full news article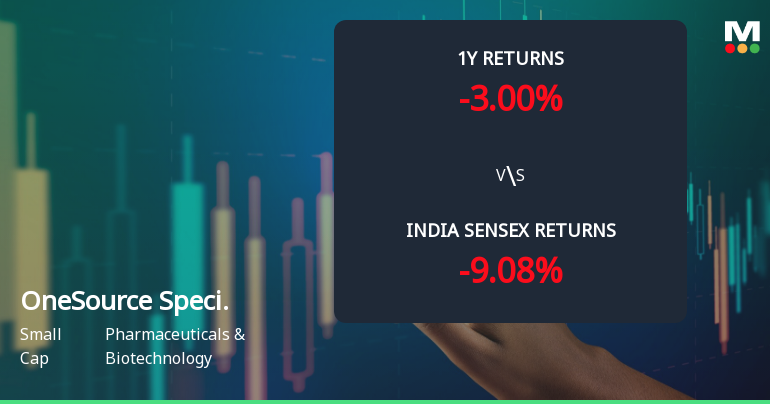
OneSource Specialty Pharma Ltd Technical Momentum Shifts Amid Mixed Market Signals
OneSource Specialty Pharma Ltd, a small-cap player in the Pharmaceuticals & Biotechnology sector, has experienced a subtle shift in its technical momentum, moving from a sideways trend to a mildly bearish stance. Despite a recent uptick in price, key technical indicators present a complex picture that warrants close attention from investors and market analysts alike.
Read full news article Announcements
Corporate Actions

No Upcoming Board Meetings

No Dividend history available

No Splits history available

No Bonus history available

No Rights history available
Quality key factors
Valuation key factors
Technicals key factors
 Technical Indicator Scale: Bearish, Mildly Bearish, Sideways, Mildly Bullish, Bullish Turned
 Shareholding Snapshot : Mar 2026
Shareholding Compare (%holding)
Non Institution
38.3808
Held by 21 Schemes (10.13%)
Held by 136 FIIs (17.5%)
Tenshi Pharmaceuticals Private Limited (18.4%)
Authum Investment And Infrastructure Limited (5.16%)
12.18%
Quarterly Results Snapshot (Consolidated) - Mar'26 - QoQ

QoQ Growth in quarter ended Mar 2026 is 47.49% vs -22.73% in Dec 2025
QoQ Growth in quarter ended Mar 2026 is 105.19% vs -945.57% in Dec 2025
Half Yearly Results Snapshot (Consolidated) - Sep'25
Growth in half year ended Sep 2025 is 380.31% vs 243.83% in Sep 2024
Growth in half year ended Sep 2025 is 114.32% vs 67.44% in Sep 2024
Nine Monthly Results Snapshot (Consolidated) - Dec'25

YoY Growth in nine months ended Dec 2025 is 84.32% vs 445.59% in Dec 2024
YoY Growth in nine months ended Dec 2025 is 44.30% vs 59.90% in Dec 2024
Annual Results Snapshot (Consolidated) - Mar'26
YoY Growth in year ended Mar 2026 is -1.61% vs 740.42% in Mar 2025
YoY Growth in year ended Mar 2026 is -310.68% vs 95.41% in Mar 2025
About OneSource Specialty Pharma Ltd

Company Coordinates


