
Compare Balaji Amines with Similar Stocks
Dashboard
Company has a Debt to Equity ratio (avg) of 0.01 times
Poor long term growth as Operating profit has grown by an annual rate -9.21% of over the last 5 years
The company has declared positive results in Mar'2026 after 7 consecutive negative quarters
With ROE of 8.5, it has a Very Expensive valuation with a 3.1 Price to Book Value
Despite the size of the company, domestic mutual funds hold only 0.26% of the company
Market Beating Performance
Stock DNA
Specialty Chemicals
INR 6,389 Cr (Small Cap)
37.00
44
0.58%
-0.07
8.46%
3.10
Total Returns (Price + Dividend) 
Latest dividend: 10.954325932033687 per share ex-dividend date: Aug-01-2025
Risk Adjusted Returns v/s
Returns Beta

News

Balaji Amines Ltd is Rated Hold by MarketsMOJO
Balaji Amines Ltd is rated 'Hold' by MarketsMOJO, with this rating last updated on 13 May 2026. However, the analysis and financial metrics discussed here reflect the company’s current position as of 30 June 2026, providing investors with an up-to-date view of its fundamentals, returns, and market standing.
Read full news article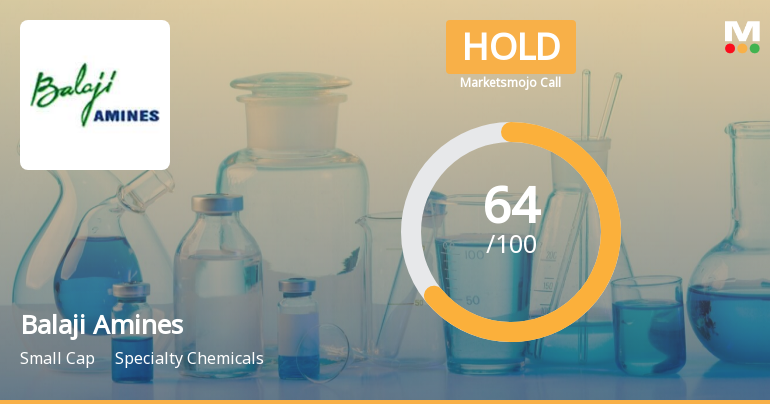
Balaji Amines Ltd is Rated Hold by MarketsMOJO
Balaji Amines Ltd is rated 'Hold' by MarketsMOJO, with this rating last updated on 13 May 2026. However, the analysis and financial metrics discussed here reflect the company’s current position as of 19 June 2026, providing investors with the latest insights into its performance and outlook.
Read full news article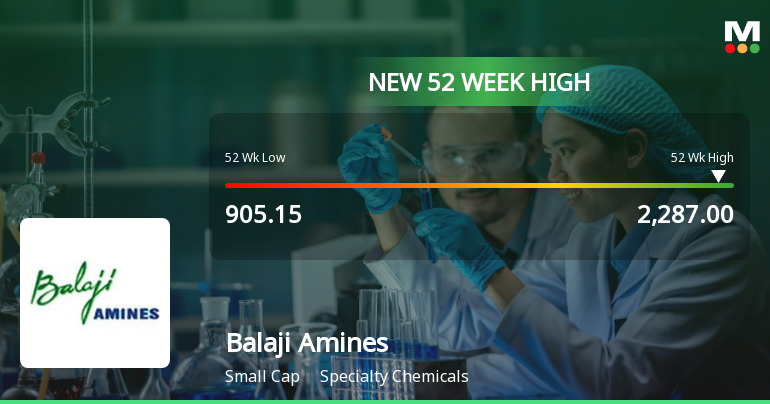
Broad-Based Technical Strength Lifts Balaji Amines Ltd to 52-Week High of Rs 2287
From a 52-week low of Rs 905.15 to a fresh high of Rs 2287 on 18 Jun 2026, Balaji Amines Ltd has surged 56.92% over the past year, significantly outperforming the Sensex which declined 5.21% in the same period. This rally is underpinned by a strong alignment of technical indicators and sustained price momentum.
Read full news article Announcements
Closure of Trading Window
27-Jun-2026 | Source : BSEIntimation of Trading Window Closure
Announcement under Regulation 30 (LODR)-Newspaper Publication
17-Jun-2026 | Source : BSESubmission of Newspaper publication in respect of Notice of 38th Annual General Meeting
Intimation Of 38Th Annual General Meeting (AGM) Of The Company Is Scheduled To Be Held On Friday 10Th July 2026 At 12:00 Noon (IST) Through Video Conference (VC)/ Other Audio-Visual Means (OAVM) For Financial Year 2025-26
16-Jun-2026 | Source : BSEIntimation of 38th Annual General Meeting (AGM) of the Company is scheduled to be held on Friday 10th July 2026 at 12:00 Noon (IST) through Video Conference (VC)/ Other Audio Visual Means (OVAM) for Financial Year 2025-26.
Corporate Actions

No Upcoming Board Meetings

Balaji Amines Ltd has declared 550% dividend, ex-date: 03 Jul 26

Balaji Amines Ltd has announced 2:10 stock split, ex-date: 18 Nov 10

Balaji Amines Ltd has announced 1:1 bonus issue, ex-date: 05 Mar 07

No Rights history available
Quality key factors
Valuation key factors
Technicals key factors
 Technical Indicator Scale: Bearish, Mildly Bearish, Sideways, Mildly Bullish, Bullish Turned
 Shareholding Snapshot : Mar 2026
Shareholding Compare (%holding)
Promoters
17.6687
Held by 6 Schemes (0.12%)
Held by 56 FIIs (2.98%)
Ande Prathap Reddy (15.34%)
Vijaya Nalla (2.13%)
35.73%
Quarterly Results Snapshot (Consolidated) - Mar'26 - QoQ

QoQ Growth in quarter ended Mar 2026 is 19.16% vs -2.72% in Dec 2025
QoQ Growth in quarter ended Mar 2026 is 101.11% vs -9.06% in Dec 2025
Half Yearly Results Snapshot (Consolidated) - Sep'25
Growth in half year ended Sep 2025 is -4.47% vs -13.34% in Sep 2024

Growth in half year ended Sep 2025 is -13.90% vs -3.64% in Sep 2024
Nine Monthly Results Snapshot (Consolidated) - Dec'25
YoY Growth in nine months ended Dec 2025 is -1.36% vs -14.93% in Dec 2024
YoY Growth in nine months ended Dec 2025 is -11.47% vs -14.15% in Dec 2024
Annual Results Snapshot (Consolidated) - Mar'26
YoY Growth in year ended Mar 2026 is 2.00% vs -14.89% in Mar 2025
YoY Growth in year ended Mar 2026 is 6.15% vs -23.10% in Mar 2025
About Balaji Amines Ltd

Company Coordinates


