
Compare Shraddha Prime with Similar Stocks
Dashboard
Low ability to service debt as the company has a high Debt to EBITDA ratio of 3.95 times
- Low ability to service debt as the company has a high Debt to EBITDA ratio of 3.95 times
Healthy long term growth as Net Sales has grown by an annual rate of 146.28% and Operating profit at 161.94%
With a growth in Net Profit of 78.41%, the company declared Outstanding results in Mar 26
With ROCE of 18.4, it has a Attractive valuation with a 2.4 Enterprise value to Capital Employed
Despite the size of the company, domestic mutual funds hold only 0% of the company
Total Returns (Price + Dividend) 
Latest dividend: 0.19840933191940616 per share ex-dividend date: Sep-24-2025
Risk Adjusted Returns v/s
Returns Beta

News
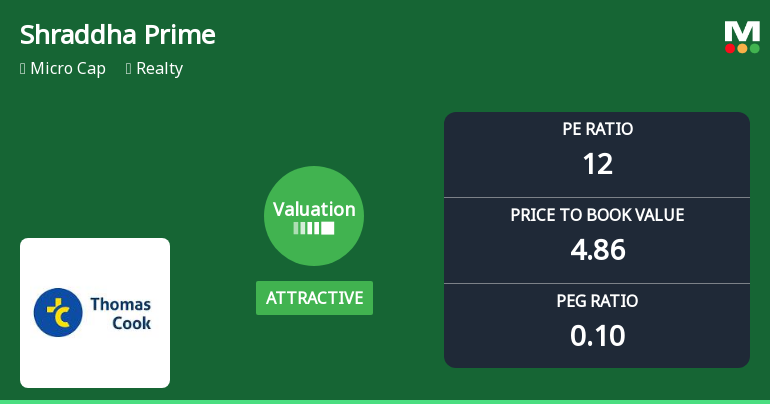
Shraddha Prime Projects Ltd Valuation Shifts Signal Renewed Price Attractiveness
Shraddha Prime Projects Ltd, a micro-cap player in the Realty sector, has witnessed a notable shift in its valuation parameters, moving from a very attractive to an attractive rating. Despite recent market headwinds and a year-to-date stock return lagging behind the Sensex, the company’s current price-to-earnings (P/E) and price-to-book value (P/BV) ratios suggest a compelling investment case relative to its peers and historical benchmarks.
Read full news article
Shraddha Prime Projects Ltd is Rated Hold
Shraddha Prime Projects Ltd is rated 'Hold' by MarketsMOJO, with this rating last updated on 09 February 2026. However, the analysis and financial metrics discussed here reflect the company’s current position as of 01 July 2026, providing investors with an up-to-date perspective on the stock’s fundamentals, valuation, financial trends, and technical outlook.
Read full news article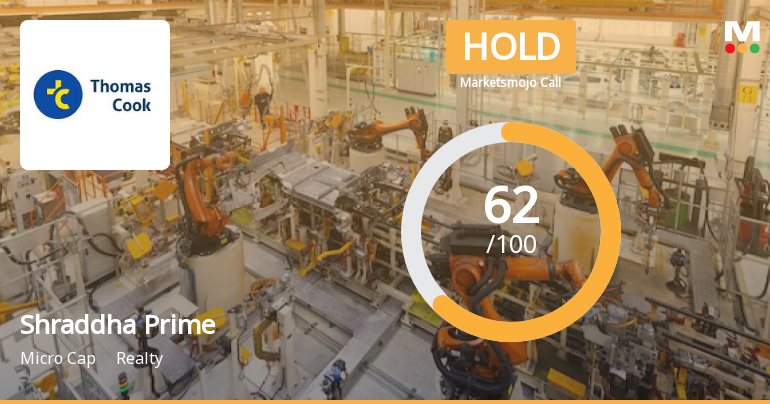
Shraddha Prime Projects Ltd is Rated Hold
Shraddha Prime Projects Ltd is rated 'Hold' by MarketsMOJO, with this rating last updated on 09 Feb 2026. However, the analysis and financial metrics discussed here reflect the company’s current position as of 20 June 2026, providing investors with the latest insights into its performance and outlook.
Read full news article Announcements
Closure of Trading Window
25-Jun-2026 | Source : BSEIntimation of Closure of Trading Window for the First quarter and three months ended on 30.06.2026
Announcement under Regulation 30 (LODR)-Newspaper Publication
08-Jun-2026 | Source : BSEIntimation of News Paper Publication
Shareholder Meeting / Postal Ballot-Notice of Postal Ballot
06-Jun-2026 | Source : BSESubmission of Notice of Postal Ballot
Corporate Actions

No Upcoming Board Meetings

Shraddha Prime Projects Ltd has declared 2% dividend, ex-date: 24 Sep 25

No Splits history available

Shraddha Prime Projects Ltd has announced 1:1 bonus issue, ex-date: 27 Jan 25

Shraddha Prime Projects Ltd has announced 365:100 rights issue, ex-date: 03 Jul 23
Quality key factors
Valuation key factors
Technicals key factors
 Technical Indicator Scale: Bearish, Mildly Bearish, Sideways, Mildly Bullish, Bullish Turned
 Shareholding Snapshot : Mar 2026
Shareholding Compare (%holding)
Promoters
23.1707
Held by 0 Schemes
Held by 0 FIIs
Sudhir Balu Mehta (74.78%)
Mehul Hasmukh Barvalia (2.6%)
24.24%
Quarterly Results Snapshot (Consolidated) - Mar'26 - QoQ

QoQ Growth in quarter ended Mar 2026 is 44.42% vs -3.96% in Dec 2025
QoQ Growth in quarter ended Mar 2026 is 68.91% vs 56.75% in Dec 2025
Half Yearly Results Snapshot (Consolidated) - Sep'25

Growth in half year ended Sep 2025 is 203.17% vs 353.49% in Sep 2024
Growth in half year ended Sep 2025 is 91.67% vs 225.27% in Sep 2024
Nine Monthly Results Snapshot (Consolidated) - Dec'25
YoY Growth in nine months ended Dec 2025 is 199.74% vs 102.22% in Dec 2024
YoY Growth in nine months ended Dec 2025 is 71.05% vs 37.10% in Dec 2024
Annual Results Snapshot (Consolidated) - Mar'26
YoY Growth in year ended Mar 2026 is 226.75% vs 85.63% in Mar 2025
YoY Growth in year ended Mar 2026 is 118.59% vs 277.34% in Mar 2025
About Shraddha Prime Projects Ltd

Company Coordinates


