
Compare Peninsula Land with Similar Stocks
Dashboard
High Debt company with Weak Long Term Fundamental Strength
- Poor long term growth as Net Sales has grown by an annual rate of -11.50% over the last 5 years
- High Debt Company with a Debt to Equity ratio (avg) of 7.30 times
The company has declared Negative results for the last 9 consecutive quarters
With ROCE of 1.5, it has a Very Expensive valuation with a 2.5 Enterprise value to Capital Employed
Below par performance in long term as well as near term
Total Returns (Price + Dividend) 
Latest dividend: 0.20000000000000004 per share ex-dividend date: Jul-28-2016
Risk Adjusted Returns v/s
Returns Beta

News

Peninsula Land Ltd is Rated Strong Sell
Peninsula Land Ltd is rated Strong Sell by MarketsMOJO, with this rating last updated on 03 Nov 2025. However, the analysis and financial metrics discussed here reflect the stock’s current position as of 18 July 2026, providing investors with an up-to-date view of the company’s fundamentals, valuation, financial trend, and technical outlook.
Read full news article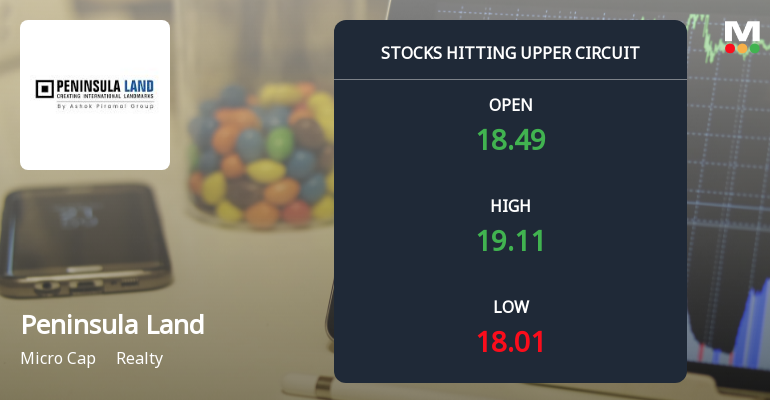
Peninsula Land Ltd Locks at Upper Circuit With 4.63% Gain — Buyers Queue, Sellers Absent
At Rs 19.25, the buying was done — not because demand dried up, but because the exchange wouldn't let the stock go any higher. Peninsula Land Ltd locked at its upper circuit of 4.63% on 13 Jul 2026, with buyers queuing and no sellers willing to part with shares.
Read full news article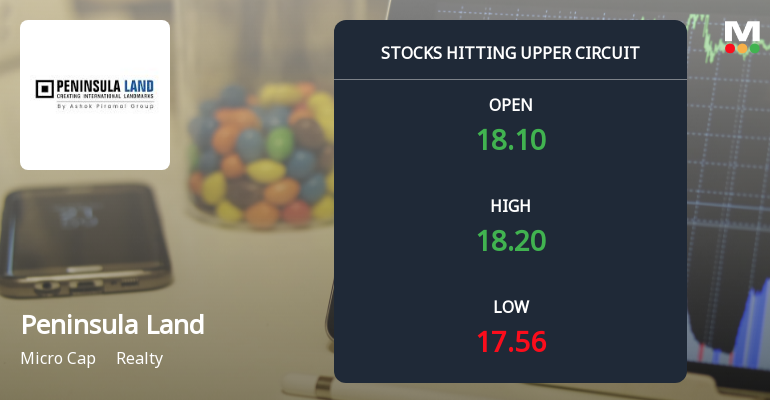
Peninsula Land Ltd Locks at Upper Circuit With 5% Gain — Buyers Queue, Sellers Absent
At Rs 18.34, the buying was done — not because demand dried up, but because the exchange wouldn't let the stock go any higher. Peninsula Land Ltd locked at its upper circuit of 4.98% on 10 Jul 2026, with buyers queuing and no sellers willing to part with shares.
Read full news article Announcements
Peninsula Land Limited - Credit Rating
26-Nov-2019 | Source : NSEPeninsula Land Limited has informed the Exchange regarding Credit Rating
Peninsula Land Limited - Outcome of Board Meeting
15-Nov-2019 | Source : NSEPeninsula Land Limited has informed the Exchange regarding Board meeting held on November 14, 2019 to consider and approve the Unaudited Standalone and Consolidated Financial Results of the Company for the quarter and period ended 30th September, 2019 along with the Statement of Assets and Liabilities and the cash flow statement as on that date.
Peninsula Land Limited - Disclosure under SEBI Takeover Regulations
09-Oct-2019 | Source : NSEDisclosure under SEBI Takeover Regulations PENINLAND : Nandan A Piramal has informed the Exchange regarding reason for encumbrance vide letter dated October 04, 2019 under SEBI ( SAST) Regulations, 2011.
Corporate Actions

No Upcoming Board Meetings

Peninsula Land Ltd has declared 10% dividend, ex-date: 28 Jul 16

Peninsula Land Ltd has announced 2:10 stock split, ex-date: 16 Oct 07

No Bonus history available

No Rights history available
Quality key factors
Valuation key factors
Technicals key factors
 Technical Indicator Scale: Bearish, Mildly Bearish, Sideways, Mildly Bullish, Bullish Turned
 Shareholding Snapshot : Mar 2026
Shareholding Compare (%holding)
Promoters
None
Held by 1 Schemes (0.0%)
Held by 5 FIIs (0.14%)
Urvi Ashok Piramal (36.27%)
None
23.88%
Quarterly Results Snapshot (Consolidated) - Mar'26 - QoQ

QoQ Growth in quarter ended Mar 2026 is 49.80% vs -27.36% in Dec 2025

QoQ Growth in quarter ended Mar 2026 is -892.03% vs 35.57% in Dec 2025
Half Yearly Results Snapshot (Consolidated) - Sep'25
Growth in half year ended Sep 2025 is -20.36% vs -70.18% in Sep 2024
Growth in half year ended Sep 2025 is -1,522.42% vs -97.71% in Sep 2024
Nine Monthly Results Snapshot (Consolidated) - Dec'25
YoY Growth in nine months ended Dec 2025 is -47.43% vs -57.55% in Dec 2024
YoY Growth in nine months ended Dec 2025 is -358.42% vs -107.40% in Dec 2024
Annual Results Snapshot (Consolidated) - Mar'26
YoY Growth in year ended Mar 2026 is -44.44% vs -54.94% in Mar 2025
YoY Growth in year ended Mar 2026 is -326.78% vs -127.95% in Mar 2025
About Peninsula Land Ltd

Company Coordinates


