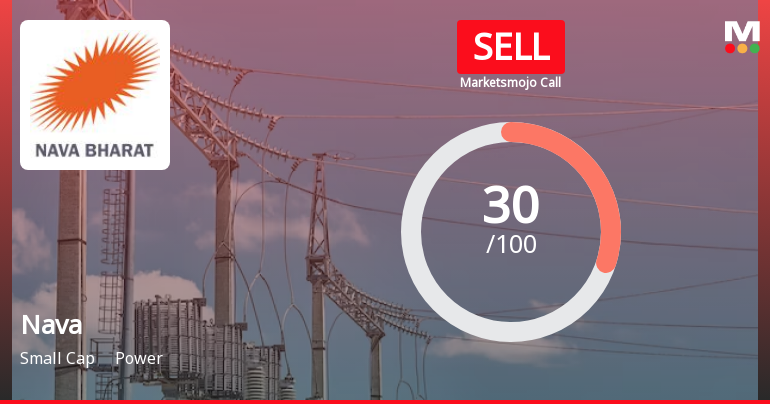
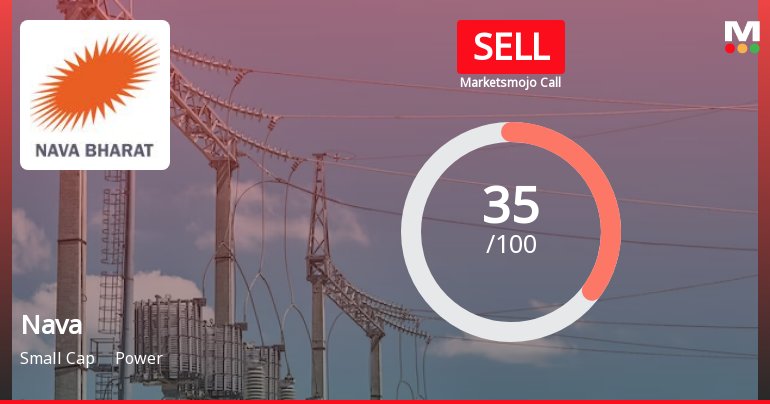
Nava

INR
560.30
-13.7 (-2.39%)
BSENSE

Aug 17, 10:39 AM

BSE+NSE Vol: 3.68 lacs

  • Price Points
  • Score
  • Mojo Parameters
  • Total Return
  • News and Corporate Actions
  • Key factors
  • Shareholding
  • Financials
  • CompanyCV
stock-summaryPrice Point
High/Low

1Day

52 Week

Valuation
Technical
Day's Volume

CASH

3.68 lacs (142.77%) Volume

Shareholding (Jun 2026)

FII

10.21%

Held by 161 FIIs

DII

0.57%

Held by 5 DIIs

Promoter

50.03%

Why is Nava Ltd falling/rising?

17-Aug-2026

As of 16-Aug, Nava Ltd's stock price is Rs 574.00, down 0.95%, with a total decline of 2.55% over the last two days. The stock has shown negative returns recently, poor long-term growth, and declining investor interest, contributing to its falling price.

As of 16-Aug, Nava Ltd's stock price is falling, currently at Rs 574.00, reflecting a decrease of Rs 5.5 or 0.95%. The stock has underperformed its sector by 0.75% today and has experienced a consecutive decline over the last two days, resulting in a total drop of 2.55% during this period. The stock reached an intraday low of Rs 561.65, which is a decrease of 3.08%.<BR><BR>In terms of performance over different periods, the stock has shown negative returns in the past week and month, with declines of 1.39% and 3.53%, respectively. Although it has a positive year-to-date return of 1.24%, this is contrasted by a 1.19% decline over the past year. The company's financials indicate poor long-term growth, with net sales growing at an annual rate of only 11.44% and operating profit at 13.79% over the last five years. Recent quarterly results have also been disappointing, with a significant drop in profit before tax and profit after tax.<BR><BR>Investor participation appears to be declining, as evidenced by a decrease in delivery volume, which has fallen by 0.36% against the five-day average. Additionally, the stock is trading at a premium compared to its peers, with a price-to-book value of 1.9, indicating a potentially expensive valuation. The low stake held by domestic mutual funds, at only 0.77%, may suggest a lack of confidence in the stock's current price or business outlook.<BR><BR>Overall, the combination of negative performance metrics, disappointing financial results, and declining investor interest contributes to the falling stock price of Nava Ltd.

View full answer

Should I buy, sell or hold Nava Ltd?

16-Aug-2026

Who are in the management team of Nava?

14-Aug-2026

The management team of Nava includes Executive Chairman D Ashok, Managing Director P Trivikrama Prasad, Executive Directors G R K Prasad and Ashwin Devineni (CEO), and Vice President VSN Raju, along with several independent directors. This team is responsible for the company's strategic direction and operations.

The management team of Nava includes the following key individuals:<BR><BR>1. **D Ashok** - Executive Chairman<BR>2. **P Trivikrama Prasad** - Managing Director<BR>3. **G R K Prasad** - Executive Director<BR>4. **Ashwin Devineni** - Executive Director & CEO<BR>5. **VSN Raju** - Vice President & Company Secretary<BR><BR>Additionally, there are several independent directors on the board:<BR><BR>1. **Koda Durga Prasad** - Independent Director<BR>2. **G P Kundargi** - Independent Director<BR>3. **Indra Kumar Alluri** - Independent Director<BR>4. **Shanti Sree Bolleni** - Independent Director<BR><BR>This team plays a crucial role in guiding the company's strategic direction and operations.

View full answer

What does Nava do?

14-Aug-2026

Nava Ltd manufactures and sells Ferro Alloys and Sugar, engages in mining, generates power, and provides operation and maintenance services for power assets. As of March 2026, it reported net sales of 1,143 Cr and a net profit of 127 Cr, with a market cap of INR 16,735 Cr.

Overview:<BR>Nava Ltd is primarily engaged in the manufacture and selling of Ferro Alloys and Sugar, Mining Activities, Generation of Power, and Operation & Maintenance Services for power assets, operating within the Small Cap category in the Power industry.<BR><BR>History:<BR>Nava Ltd was incorporated on November 7, 1972, originally as Nava Bharat Ventures Limited, and changed its name to Nava Ltd in July 2022. The latest quarterly results reported net sales and net profit for the period ending March 2026.<BR><BR>Financial Snapshot:<BR>Most recent Net Sales: 1,143 Cr (Quarterly Results - Mar 2026) <BR>Most recent Net Profit: 127 Cr (Quarterly Results - Mar 2026) <BR>Market-cap value: INR 16,735 Cr (Small Cap)<BR><BR>Key Metrics:<BR>P/E: 21.00 <BR>Industry P/E: 22 <BR>Dividend Yield: 1.44% <BR>Debt Equity: -0.14 <BR>Return on Equity: 9.01% <BR>Price to Book: 1.91 <BR><BR>Contact Details:<BR>Address: Nava Bharat Chambers, 6-3-1109/1 Raj Bhavan Road Hyderabad Telangana : 500082 <BR>Tel: 91-40-23403501/23403540 <BR>Email: nbvl@nbv.in/secretarial@nbv.in/grd@ <BR>Website: http://www.nbventures.com

View full answer

Who are the peers of the Nava?

14-Aug-2026

Peers of Nava include NHPC Ltd, Torrent Power, NLC India, SJVN, CESC, JP Power Ven., and Reliance Power. In terms of management risk, Torrent Power is excellent, while others vary from average to below average; NLC India leads in 1-year returns at 13.51%, with Nava at -5.86%.

Peers: The peers of the Nava are NHPC Ltd, Torrent Power, NLC India, SJVN, CESC, JP Power Ven., and Reliance Power.<BR><BR>Quality Snapshot: Excellent management risk is observed at Torrent Power, while Average management risk is found at NHPC Ltd, NLC India, SJVN, CESC, Nava, and Reliance Power, and Below Average management risk is noted at JP Power Ven. Growth is Excellent at Torrent Power, Good at NLC India, Average at SJVN, and Below Average at NHPC Ltd, CESC, Nava, JP Power Ven., and Reliance Power. Capital Structure is Excellent at Nava, Average at Torrent Power and JP Power Ven., and Below Average at NHPC Ltd, NLC India, SJVN, CESC, and Reliance Power.<BR><BR>Return Snapshot: NLC India has the highest 1-year return at 13.51%, while Reliance Power has the lowest at -45.32%, with Nava's own 1-year return at -5.86% being significantly better than Reliance Power's. Additionally, the six-month return is negative for SJVN, Torrent Power, NLC India, JP Power Ven., and Reliance Power.

View full answer

How big is Nava?

14-Aug-2026

As of 14th August, Nava Ltd has a market capitalization of 16,246.10 Cr, with recent Net Sales of 4,290.92 Cr and a Net Profit of 786.66 Cr. The company has Shareholder's Funds of 8,745.30 Cr and Total Assets of 14,365.07 Cr.

As of 14th August, Nava Ltd has a market capitalization of 16,246.10 Cr, categorizing it as a Small Cap company.<BR><BR>In the latest four quarters, Nava reported Net Sales of 4,290.92 Cr and a Net Profit of 786.66 Cr.<BR><BR>For the reporting period of March 2026, the company has Shareholder's Funds amounting to 8,745.30 Cr and Total Assets of 14,365.07 Cr.

View full answer

When is the next results date for Nava Ltd?

04-Aug-2026

The next results date for Nava Ltd is 14 August 2026.

The next results date for Nava Ltd is scheduled for 14 August 2026.

View full answer

Are Nava Ltd latest results good or bad?

16-May-2026

Nava Ltd's latest Q4 FY26 results show a 12.24% increase in net sales to ₹1,142.85 crores, but a concerning 45.77% drop in net profit to ₹127.13 crores, marking two consecutive quarters of declining profitability and operational challenges. Investors should be cautious due to deteriorating margins and rising costs.

Nava Ltd's latest results for Q4 FY26 indicate a challenging financial performance. While the company achieved a net sales growth of 12.24% year-on-year, reaching ₹1,142.85 crores, its consolidated net profit fell significantly by 45.77% year-on-year to ₹127.13 crores. This decline in profit is concerning, especially as it marks the second consecutive quarter of decreasing profitability, with a sharp sequential drop of 42.74% from the previous quarter.<BR><BR>Additionally, the operating margin has deteriorated to 32.48%, the lowest in eight quarters, reflecting operational inefficiencies and rising costs, particularly in employee expenses, which surged by nearly 79% year-on-year. The effective tax rate also spiked to 58.03%, raising questions about the sustainability of earnings quality.<BR><BR>Overall, the results suggest that while Nava Ltd is experiencing top-line growth, it is struggling with significant profitability challenges and operational pressures. Investors should be cautious, as the combination of declining profits, margin compression, and elevated tax rates points to underlying issues that could impact future performance.

View full answer

Is Nava technically bullish or bearish?

24-Nov-2025

As of November 21, 2025, Nava's technical trend has shifted to mildly bearish, supported by bearish MACD readings, Bollinger Bands, KST, and OBV, despite a mildly bullish signal from daily moving averages.

As of 21 November 2025, the technical trend for Nava has changed from sideways to mildly bearish. The current stance is mildly bearish, driven by weekly and monthly MACD readings indicating a bearish trend, alongside a bearish signal from Bollinger Bands on the weekly timeframe. The KST and OBV also reflect a mildly bearish outlook on both weekly and monthly bases. Although daily moving averages show a mildly bullish signal, the overall indicators suggest a prevailing bearish sentiment.

View full answer

How has been the historical performance of Nava?

21-Nov-2025

Nava has demonstrated consistent growth in net sales and profitability, with net sales rising from 2,548.50 Cr in Mar'21 to 3,983.55 Cr in Mar'25, and profit after tax increasing from 554.46 Cr to 1,435.72 Cr in the same period. Overall, the company has shown robust growth in sales, profits, and cash flow, alongside an increase in total assets and liabilities.

Answer:<BR>The historical performance of Nava shows a consistent growth trend in net sales and profitability over the years.<BR><BR>Breakdown:<BR>Nava's net sales have increased from 2,548.50 Cr in Mar'21 to 3,983.55 Cr in Mar'25, reflecting a steady upward trajectory. The total operating income followed a similar pattern, rising from 2,758.72 Cr in Mar'20 to 3,983.55 Cr in Mar'25. The operating profit (PBDIT) also demonstrated growth, reaching 1,986.78 Cr in Mar'25, up from 1,318.31 Cr in Mar'21. Profit before tax has shown a significant increase, climbing from 671.55 Cr in Mar'21 to 1,608.49 Cr in Mar'25, while profit after tax rose from 554.46 Cr to 1,435.72 Cr in the same period. The consolidated net profit reached 1,091.48 Cr in Mar'25, compared to 423.24 Cr in Mar'21. Total assets have grown from 9,282.52 Cr in Mar'20 to 11,262.27 Cr in Mar'25, while total liabilities increased from 9,635.50 Cr to 11,262.27 Cr during the same timeframe. Cash flow from operating activities also improved, amounting to 2,157.00 Cr in Mar'25, up from 526.00 Cr in Mar'20, indicating a positive cash flow trend. Overall, Nava has shown robust growth in sales, profits, and cash flow, alongside a steady increase in assets and liabilities.

View full answer

Is Nava overvalued or undervalued?

13-Nov-2025

As of November 12, 2025, Nava is considered overvalued with a valuation grade of expensive, reflected by a PE ratio of 17.09, compared to more attractive peers like NTPC at 13.35 and Tata Power Co. at 30.75, despite a 17.76% return over the past year.

As of 12 November 2025, the valuation grade for Nava has moved from very expensive to expensive. Based on the current analysis, the company appears to be overvalued. Key ratios include a PE ratio of 17.09, an EV to EBITDA of 8.58, and a Price to Book Value of 1.95. <BR><BR>In comparison to its peers, NTPC is rated attractive with a PE ratio of 13.35, while Tata Power Co. is also attractive with a significantly higher PE ratio of 30.75. The substantial difference in valuation metrics suggests that Nava is priced higher relative to its peers, indicating a potential overvaluation. Despite recent stock performance showing a 17.76% return over the past year compared to the Sensex's 7.36%, the current valuation metrics do not support a favorable investment outlook.

View full answer

Who are the top shareholders of the Nava?

06-Jun-2025

The top shareholders of Nava include Nav Developers Limited with 11.37%, foreign institutional investors holding 9.74%, and individual investors collectively owning 32.75%, with Sunitha Vemulapalli as the largest individual shareholder at 1.43%. Additionally, mutual funds hold a combined 0.17% across 12 schemes.

The top shareholders of Nava include the promoters, who are the majority shareholders. The promoter with the highest holding is Nav Developers Limited, which owns 11.37% of the company. Additionally, foreign institutional investors (FIIs) hold 9.74% of the shares, distributed among 167 different FIIs. On the public side, the highest individual shareholder is Sunitha Vemulapalli, with a holding of 1.43%. Individual investors collectively hold 32.75% of the shares. There are also mutual funds involved, with 12 schemes holding a combined 0.17%.

View full answer

What is the bonus history of the Nava?

06-Jun-2025

Nava Ltd announced a 1:1 bonus issue on September 1, 2016, with a record date of September 3, 2016, allowing shareholders to double their holdings by receiving an additional share for each share held.

Nava Ltd has a bonus history that includes a 1:1 bonus issue announced on September 1, 2016. The record date for this bonus was September 3, 2016. This means that for every share held, shareholders received an additional share, effectively doubling their holdings at that time. If you have any more questions about Nava or need further details, feel free to ask!

View full answer

Has Nava declared dividend?

06-Jun-2025

Nava Ltd has declared a 200% dividend, amounting to 4 per share, with an ex-date of August 30, 2024. The company has shown strong total returns across various periods, with a total return of 2478.4% over the last 5 years.

Nava Ltd has declared a 200% dividend.<BR><BR>Dividend Details:<BR>- Percentage announced: 200%<BR>- Amount per share: 4 per share<BR>- Ex-date: 30 Aug 24<BR><BR>Dividend Yield: 0.76%.<BR><BR>Total Returns by Period:<BR>In the last 6 months, the price return was 0.93%, with a dividend return of 0%, resulting in a total return of 0.93%.<BR><BR>Over the past year, the price return was 78.78%, the dividend return was 2.45%, leading to a total return of 81.23%.<BR><BR>In the 2-year period, the price return reached 291.88%, with a dividend return of 8.87%, culminating in a total return of 300.75%.<BR><BR>For the 3-year period, the price return was 491.2%, the dividend return was 23.33%, which resulted in a total return of 514.53%.<BR><BR>In the last 4 years, the price return soared to 1047.13%, with a dividend return of 41.49%, achieving a total return of 1088.62%.<BR><BR>Finally, over the 5-year period, the price return was an impressive 2395.0%, with a dividend return of 83.40%, leading to a total return of 2478.4%.<BR><BR>Overall, Nava Ltd has declared a significant dividend and demonstrated strong total returns across all periods, indicating robust financial performance and shareholder value enhancement.

View full answer
iScoreScore
Click here to find our call on this stock
Strong Sell
Sell
Hold
Buy
Strong Buy

Dashboard

1

Poor long term growth as Net Sales has grown by an annual rate of 11.44% and Operating profit at 13.79% over the last 5 years

 
2

Flat results in Jun 26

3

With ROE of 9, it has a Very Expensive valuation with a 1.9 Price to Book Value

4

Despite the size of the company, domestic mutual funds hold only 0.77% of the company

stock-summaryMojo Parameters

Mojo Parameters

Loading Valuation Snapshot...

Stock DNA

stock-summary
Industry

Power

stock-summary
Market cap

INR 15,871 Cr (Small Cap)

stock-summary
P/E

21.00

stock-summary
Industry P/E

22

stock-summary
Dividend Yield

1.48%

stock-summary
Debt Equity

-0.14

stock-summary
Return on Equity

9.01%

stock-summary
Price to Book

1.86

Revenue and Profits:
Net Sales:
1,212 Cr
(Quarterly Results - Jun 2026)
Net Profit:
277 Cr
stock-summaryTotal Returns
Total Returns (Price + Dividend) stock-summary
Dividend Yield (1.48%)
TimePeriod
Price Return
Dividend Return
Total Return
3 Months
-10.84%
0.91%
-9.93%
6 Months
0.46%
0.97%
1.43%
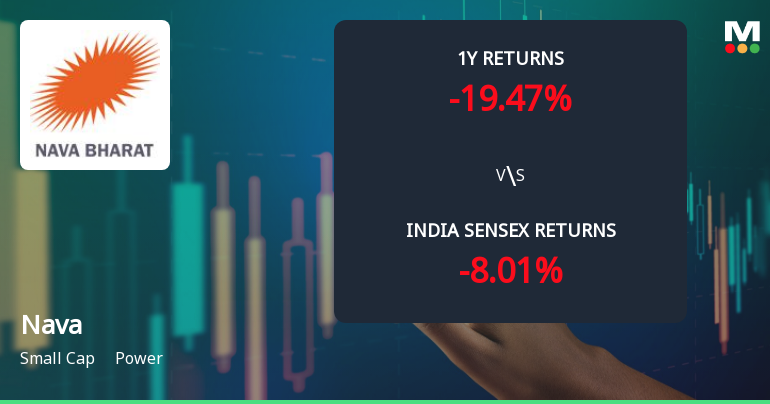
1 Year
-3.55%
1.27%
-2.28%
2 Years
20.53%
3.41%
23.94%
3 Years
190.79%
8.87%
199.66%
4 Years
328.59%
19.62%
348.21%
5 Years
921.89%
42.65%
964.54%

Latest dividend: 5.5 per share ex-dividend date: Aug-07-2026

Risk Adjusted Returns v/s stock-summary
Returns Beta
Icon
Beta has not been calculated since enough price history is not available
stock-summaryNews & Corporate Actions

Announcements stock-summary

Announcement under Regulation 30 (LODR)-Newspaper Publication

15-Aug-2026 | Source : BSE

Disclosure

Announcement under Regulation 30 (LODR)-Newspaper Publication

15-Aug-2026 | Source : BSE

Disclosure

Announcement under Regulation 30 (LODR)-Press Release / Media Release

14-Aug-2026 | Source : BSE

Disclosure

Corporate Actions stock-summary

stock-summary
BOARD MEETING

No Upcoming Board Meetings

stock-summary
DIVIDEND

Nava Ltd has declared 550% dividend, ex-date: 07 Aug 26

stock-summary
SPLITS

Nava Ltd has announced 1:2 stock split, ex-date: 20 Jan 25

stock-summary
BONUS

Nava Ltd has announced 1:1 bonus issue, ex-date: 01 Sep 16

stock-summary
RIGHTS

No Rights history available

stock-summaryKey Factors

Quality key factors stock-summary

Factor
Value
Sales Growth (5y)
11.44%
EBIT Growth (5y)
13.79%
EBIT to Interest (avg)
37.78
Debt to EBITDA (avg)
1.47
Net Debt to Equity (avg)
-0.14
Sales to Capital Employed (avg)
0.43
Tax Ratio
32.64%
Dividend Payout Ratio
30.59%
Pledged Shares
0
Institutional Holding
10.77%
ROCE (avg)
17.37%
ROE (avg)
12.64%

Valuation key factors

Factor
Value
P/E Ratio
21
Industry P/E
22
Price to Book Value
1.86
EV to EBIT
11.98
EV to EBITDA
9.07
EV to Capital Employed
2.00
EV to Sales
3.49
PEG Ratio
NA
Dividend Yield
1.48%
ROCE (Latest)
17.66%
ROE (Latest)
9.01%

Technicals key factors

Indicator
Weekly
Monthly
MACD
Bearish
Mildly Bearish
RSI
No Signal
No Signal
Bollinger Bands
Bearish
Bullish
Moving Averages
Mildly Bullish (Daily)
KST
Bearish
Mildly Bearish
Dow Theory
No Trend
No Trend
OBV
Mildly Bullish
No Trend
stock-summary Technical Indicator Scale: Bearish, Mildly Bearish, Sideways, Mildly Bullish, Bullish  Turned 
stock-summaryShareholding
Shareholding Snapshot : Jun 2026stock-summary
Shareholding Compare (%holding) stock-summary
Majority shareholders

Promoters

Pledged Promoter Holdings

None

Mutual Funds

Held by 17 Schemes (0.39%)

FIIs

Held by 161 FIIs (10.21%)

Promoter with highest holding

Nav Developers Limited (11.37%)

Highest Public shareholder

Sunitha Vemulapalli (1.43%)

Individual Investors Holdings

31.55%

stock-summaryFinancial
[
  {
    "link": "quarterly",
    "btn_text": "All Quarterly Results",
    "header": "Quarterly Results Snapshot (Consolidated) - Jun'26 - YoY",
    "rhs": [
      {
        "prefix": "Net Sales ",
        "suffix": "YoY Growth in quarter ended Jun 2026 is 1.56% vs -2.38% in Jun 2025",
        "dir": 1
      },
      {
        "prefix": "Consolidated Net Profit ",
        "suffix": "YoY Growth in quarter ended Jun 2026 is -9.99% vs -13.39% in Jun 2025",
        "dir": 1
      }
    ],
    "table": {
      "header": [
        "Jun'26",
        "Jun'25",
        "Change(%)"
      ],
      "body": [
        {
          "field": "Net Sales",
          "val1": "1,211.80",
          "val2": "1,193.22",
          "chgp": "1.56%",
          "chgp_class": "positive"
        },
        {
          "field": "Operating Profit (PBDIT) excl Other Income",
          "val1": "526.51",
          "val2": "588.33",
          "chgp": "-10.51%",
          "chgp_class": "negative"
        },
        {
          "field": "Interest",
          "val1": "2.49",
          "val2": "1.31",
          "chgp": "90.08%",
          "chgp_class": "negative"
        },
        {
          "field": "Exceptional Items",
          "val1": "-0.41",
          "val2": "-0.32",
          "chgp": "-28.12%",
          "chgp_class": "negative"
        },
        {
          "field": "Consolidate Net Profit",
          "val1": "277.27",
          "val2": "308.03",
          "chgp": "-9.99%",
          "chgp_class": "negative"
        },
        {
          "field": "Operating Profit Margin (Excl OI)",
          "val1": "43.45%",
          "val2": "49.31%",
          "chgp": "-5.86%",
          "chgp_class": "negative"
        }
      ]
    }
  },
  {
    "link": "half-yearly",
    "btn_text": "All Half Yearly Results",
    "header": "Half Yearly Results Snapshot (Consolidated) - Sep'25",
    "rhs": [
      {
        "prefix": "Net Sales ",
        "suffix": " Growth in half year ended Sep 2025 is 1.61% vs 8.07% in Sep 2024",
        "dir": -1
      },
      {
        "prefix": "Consolidated Net Profit ",
        "suffix": " Growth in half year ended Sep 2025 is -27.89% vs 48.22% in Sep 2024",
        "dir": -1
      }
    ],
    "table": {
      "header": [
        "Sep'25",
        "Sep'24",
        "Change(%)"
      ],
      "body": [
        {
          "field": "Net Sales",
          "val1": "2,156.96",
          "val2": "2,122.85",
          "chgp": "1.61%",
          "chgp_class": "positive"
        },
        {
          "field": "Operating Profit (PBDIT) excl Other Income",
          "val1": "903.59",
          "val2": "1,003.68",
          "chgp": "-9.97%",
          "chgp_class": "negative"
        },
        {
          "field": "Interest",
          "val1": "4.10",
          "val2": "15.12",
          "chgp": "-72.88%",
          "chgp_class": "positive"
        },
        {
          "field": "Exceptional Items",
          "val1": "-0.72",
          "val2": "1.74",
          "chgp": "-141.38%",
          "chgp_class": "negative"
        },
        {
          "field": "Consolidate Net Profit",
          "val1": "437.53",
          "val2": "606.74",
          "chgp": "-27.89%",
          "chgp_class": "negative"
        },
        {
          "field": "Operating Profit Margin (Excl OI)",
          "val1": "41.89%",
          "val2": "47.28%",
          "chgp": "-5.39%",
          "chgp_class": "negative"
        }
      ]
    }
  },
  {
    "link": "nine-monthly",
    "btn_text": "All Nine Monthly Results",
    "header": "Nine Monthly Results Snapshot (Consolidated) - Dec'25",
    "rhs": [
      {
        "prefix": "Net Sales ",
        "suffix": "YoY Growth in nine months ended Dec 2025 is 6.16% vs 2.46% in Dec 2024",
        "dir": 1
      },
      {
        "prefix": "Consolidated Net Profit ",
        "suffix": "YoY Growth in nine months ended Dec 2025 is -23.05% vs 16.21% in Dec 2024",
        "dir": -1
      }
    ],
    "table": {
      "header": [
        "Dec'25",
        "Dec'24",
        "Change(%)"
      ],
      "body": [
        {
          "field": "Net Sales",
          "val1": "3,148.08",
          "val2": "2,965.34",
          "chgp": "6.16%",
          "chgp_class": "positive"
        },
        {
          "field": "Operating Profit (PBDIT) excl Other Income",
          "val1": "1,346.20",
          "val2": "1,453.52",
          "chgp": "-7.38%",
          "chgp_class": "negative"
        },
        {
          "field": "Interest",
          "val1": "4.86",
          "val2": "21.14",
          "chgp": "-77.01%",
          "chgp_class": "positive"
        },
        {
          "field": "Exceptional Items",
          "val1": "-1.14",
          "val2": "-1.40",
          "chgp": "18.57%",
          "chgp_class": "positive"
        },
        {
          "field": "Consolidate Net Profit",
          "val1": "659.54",
          "val2": "857.07",
          "chgp": "-23.05%",
          "chgp_class": "negative"
        },
        {
          "field": "Operating Profit Margin (Excl OI)",
          "val1": "42.76%",
          "val2": "49.02%",
          "chgp": "-6.26%",
          "chgp_class": "negative"
        }
      ]
    }
  },
  {
    "link": "annual",
    "btn_text": "All Annual Results",
    "header": "Annual Results Snapshot (Consolidated) - Mar'26",
    "rhs": [
      {
        "prefix": "Net Sales ",
        "suffix": "YoY Growth in year ended Mar 2026 is 7.72% vs 4.33% in Mar 2025",
        "dir": 1
      },
      {
        "prefix": "Consolidated Net Profit ",
        "suffix": "YoY Growth in year ended Mar 2026 is -27.93% vs 15.66% in Mar 2025",
        "dir": -1
      }
    ],
    "table": {
      "header": [
        "Mar'26",
        "Mar'25",
        "Change(%)"
      ],
      "body": [
        {
          "field": "Net Sales",
          "val1": "4,290.92",
          "val2": "3,983.55",
          "chgp": "7.72%",
          "chgp_class": "positive"
        },
        {
          "field": "Operating Profit (PBDIT) excl Other Income",
          "val1": "1,717.41",
          "val2": "1,835.16",
          "chgp": "-6.42%",
          "chgp_class": "negative"
        },
        {
          "field": "Interest",
          "val1": "11.93",
          "val2": "25.88",
          "chgp": "-53.90%",
          "chgp_class": "positive"
        },
        {
          "field": "Exceptional Items",
          "val1": "-1.43",
          "val2": "-1.72",
          "chgp": "16.86%",
          "chgp_class": "positive"
        },
        {
          "field": "Consolidate Net Profit",
          "val1": "786.67",
          "val2": "1,091.48",
          "chgp": "-27.93%",
          "chgp_class": "negative"
        },
        {
          "field": "Operating Profit Margin (Excl OI)",
          "val1": "40.02%",
          "val2": "46.07%",
          "chgp": "-6.05%",
          "chgp_class": "negative"
        }
      ]
    }
  }
]

Quarterly Results Snapshot (Consolidated) - Jun'26 - YoYstock-summary

Jun'26
Jun'25
Change(%)
Net Sales
1,211.80
1,193.22
1.56%
Operating Profit (PBDIT) excl Other Income
526.51
588.33
-10.51%
Interest
2.49
1.31
90.08%
Exceptional Items
-0.41
-0.32
-28.12%
Consolidate Net Profit
277.27
308.03
-9.99%
Operating Profit Margin (Excl OI)
43.45%
49.31%
-5.86%
Values in Rs Cr.
Direction Arrows
Net Sales

YoY Growth in quarter ended Jun 2026 is 1.56% vs -2.38% in Jun 2025

Direction Arrows
Consolidated Net Profit

YoY Growth in quarter ended Jun 2026 is -9.99% vs -13.39% in Jun 2025

Half Yearly Results Snapshot (Consolidated) - Sep'25stock-summary

Sep'25
Sep'24
Change(%)
Net Sales
2,156.96
2,122.85
1.61%
Operating Profit (PBDIT) excl Other Income
903.59
1,003.68
-9.97%
Interest
4.10
15.12
-72.88%
Exceptional Items
-0.72
1.74
-141.38%
Consolidate Net Profit
437.53
606.74
-27.89%
Operating Profit Margin (Excl OI)
41.89%
47.28%
-5.39%
Values in Rs Cr.
Direction Arrows
Net Sales

Growth in half year ended Sep 2025 is 1.61% vs 8.07% in Sep 2024

Direction Arrows
Consolidated Net Profit

Growth in half year ended Sep 2025 is -27.89% vs 48.22% in Sep 2024

Nine Monthly Results Snapshot (Consolidated) - Dec'25stock-summary

Dec'25
Dec'24
Change(%)
Net Sales
3,148.08
2,965.34
6.16%
Operating Profit (PBDIT) excl Other Income
1,346.20
1,453.52
-7.38%
Interest
4.86
21.14
-77.01%
Exceptional Items
-1.14
-1.40
18.57%
Consolidate Net Profit
659.54
857.07
-23.05%
Operating Profit Margin (Excl OI)
42.76%
49.02%
-6.26%
Values in Rs Cr.
Direction Arrows
Net Sales

YoY Growth in nine months ended Dec 2025 is 6.16% vs 2.46% in Dec 2024

Direction Arrows
Consolidated Net Profit

YoY Growth in nine months ended Dec 2025 is -23.05% vs 16.21% in Dec 2024

Annual Results Snapshot (Consolidated) - Mar'26stock-summary

Mar'26
Mar'25
Change(%)
Net Sales
4,290.92
3,983.55
7.72%
Operating Profit (PBDIT) excl Other Income
1,717.41
1,835.16
-6.42%
Interest
11.93
25.88
-53.90%
Exceptional Items
-1.43
-1.72
16.86%
Consolidate Net Profit
786.67
1,091.48
-27.93%
Operating Profit Margin (Excl OI)
40.02%
46.07%
-6.05%
Values in Rs Cr.
Direction Arrows
Net Sales

YoY Growth in year ended Mar 2026 is 7.72% vs 4.33% in Mar 2025

Direction Arrows
Consolidated Net Profit

YoY Growth in year ended Mar 2026 is -27.93% vs 15.66% in Mar 2025

stock-summaryCompany CV
About Nava Ltd stock-summary
stock-summary
Nava Ltd
Small Cap
Power
Nava Limited was formerly incorporated as Nava Bharat Ventures Limited on November 7, 1972. The name was changed from 'Nava Bharat Ventures Limited' to Nava Limited in July, 2022. The Company is primarily engaged in the business of manufacture and selling of Ferro Alloys and Sugar, Mining Activities, Generation of Power, and Operation & Maintenance Services for power assets.
Company Coordinates stock-summary
Company Details
Nava Bharat Chambers, 6-3-1109/1 Raj Bhavan Road Hyderabad Telangana : 500082
stock-summary
Tel: 91-40-23403501/23403540
stock-summary
nbvl@nbv.in/secretarial@nbv.in/grd@
Registrar Details
Karvy Computershare Pvt Ltd, Plot No 17-24 , Near Image Hospital,, Reliance Cybervilae,Vithalrao Nagar,, Madhapur, Hyderabad