CESC

INR
154.12
0.12 (0.08%)
BSENSE

Aug 26, 10:06 AM

BSE+NSE Vol: 3.12 lacs

  • Price Points
  • Score
  • Mojo Parameters
  • Total Return
  • News and Corporate Actions
  • Key factors
  • Shareholding
  • Financials
  • CompanyCV
stock-summaryPrice Point
High/Low

1Day

52 Week

Valuation
Technical
Day's Volume

CASH

3.12 lacs (-35.78%) Volume

Shareholding (Jun 2026)

FII

11.47%

Held by 180 FIIs

DII

26.16%

Held by 85 DIIs

Promoter

52.11%

Why is CESC Ltd falling/rising?

26-Aug-2026

As of 25-Aug, CESC Ltd's stock is at 153.85, down 0.97%, underperforming its sector and moving averages, with a significant drop in investor participation. The stock has decreased 8.42% over the past week and 5.67% in the past month, facing challenges like weak profit growth and high debt levels despite a high dividend yield.

As of 25-Aug, CESC Ltd's stock price is falling, currently at 153.85, reflecting a change of -1.5 (-0.97%). The stock has underperformed its sector by 1.67% today and is trading lower than its moving averages across various time frames, including the 5-day, 20-day, 50-day, 100-day, and 200-day averages. Additionally, there has been a significant decline in investor participation, with delivery volume dropping by 63.76% compared to the 5-day average.<BR><BR>Over the past week, the stock has decreased by 8.42%, while the Sensex has gained 0.54%. In the past month, CESC Ltd has fallen by 5.67%, contrasting with a 2.10% increase in the benchmark index. Year-to-date, the stock is down 8.12%, and over the last year, it has declined by 6.36%, while the Sensex has only decreased by 4.88%. <BR><BR>Despite a high dividend yield of 7.73% and a relatively attractive valuation with a Return on Capital Employed (ROCE) of 7.8%, the company faces challenges such as weak long-term fundamental strength, indicated by a -0.78% CAGR growth in operating profits over the last five years and a high Debt to EBITDA ratio of 6.29 times. These factors contribute to the stock's decline, as investors may be concerned about the company's ability to manage its debt and generate consistent profits.

View full answer

Should I buy, sell or hold CESC Ltd?

20-Aug-2026

Who are in the management team of CESC?

14-Aug-2026

The management team of CESC includes Chairman Sanjiv Goenka, Managing Directors Rabi Chowdhury and Debasish Banerjee, and several non-executive and independent directors, bringing diverse expertise to the company.

The management team of CESC includes the following key individuals:<BR><BR>1. **Sanjiv Goenka** - Chairman (Non-Executive)<BR>2. **P K Khaitan** - Non-Executive & Non-Independent Director<BR>3. **C K Dhanuka** - Non-Executive & Independent Director<BR>4. **Rekha Sethi** - Non-Executive & Independent Director<BR>5. **Pratip Chaudhuri** - Non-Executive & Independent Director<BR>6. **Rabi Chowdhury** - Managing Director<BR>7. **Debasish Banerjee** - Managing Director<BR>8. **Shashwat Goenka** - Vice Chairman<BR>9. **Sunil Mitra** - Non-Executive & Independent Director<BR>10. **Jagdish Patra** - Company Secretary & Compliance Officer<BR>11. **Debanjan Mandal** - Non-Executive & Independent Director<BR><BR>This team brings a diverse range of experience and expertise to the company.

View full answer

What does CESC do?

14-Aug-2026

CESC Ltd is an integrated power utility company involved in electricity generation and distribution, with a market cap of INR 21,587 Cr and a net profit of 402 Cr reported for June 2026. It has a P/E ratio of 14.00 and a dividend yield of 3.70%.

Overview: <BR>CESC Ltd is an integrated power utility company engaged in the generation and distribution of electricity, operating within the small cap segment of the power industry.<BR><BR>History: <BR>CESC Ltd was incorporated in 1899 and has been continuously engaged in its operations since then. The latest quarterly results reported net sales and net profit for June 2026.<BR><BR>Financial Snapshot: <BR>Net Sales: 5,485 Cr (Quarterly Results - Jun 2026) <BR>Net Profit: 402 Cr (Quarterly Results - Jun 2026) <BR>Market Cap: INR 21,587 Cr (Small Cap)<BR><BR>Key Metrics: <BR>P/E: 14.00 <BR>Industry P/E: 22 <BR>Dividend Yield: 3.70% <BR>Debt-Equity: 1.28 <BR>Return on Equity: 12.28% <BR>Price to Book: 1.72 <BR><BR>Contact Details: <BR>Address: CESC House, Chowringhee Square Kolkata West Bengal : 700001 <BR>Tel: 91-33-22256040 <BR>Email: secretarial@rp-sg.in <BR>Website: http://www.cesc.co.in

View full answer

Who are the peers of the CESC?

14-Aug-2026

CESC's peers include NTPC Green Ene., NHPC Ltd, Torrent Power, NLC India, SJVN, Nava, and JP Power Ven. In terms of performance, NLC India leads with a 1-year return of 13.51%, while CESC has a return of 0.30%, and SJVN shows the lowest at -28.19%.

Peers: The peers of CESC are NTPC Green Ene., NHPC Ltd, Torrent Power, NLC India, SJVN, Nava, and JP Power Ven.<BR><BR>Quality Snapshot: Excellent management risk is observed at Torrent Power, while Below Average management risk is found at NTPC Green Ene. and JP Power Ven. Average management risk is present at NHPC Ltd, NLC India, SJVN, and Nava. In terms of growth, Excellent growth is noted at Torrent Power, Good growth is seen at NLC India, while Average growth is found at SJVN, NHPC Ltd, and Nava, and Below Average growth is observed at CESC, NTPC Green Ene., and JP Power Ven. For capital structure, Excellent capital structure is noted at Nava, while Average capital structure is found at Torrent Power, and Below Average capital structure is present at NTPC Green Ene., NHPC Ltd, NLC India, SJVN, CESC, and JP Power Ven.<BR><BR>Return Snapshot: NLC India has the highest 1-year return at 13.51%, while SJVN has the lowest at -28.19%. CESC's 1-year return of 0.30% is higher than SJVN's but lower than NLC India's. Additionally, the six-month returns are negative for SJVN, Torrent Power, and Nava.

View full answer

How big is CESC?

14-Aug-2026

As of 14th August, CESC Ltd has a market capitalization of 22,262.96 Cr, with recent net sales of 18,853.00 Cr and a net profit of 1,554.00 Cr. Shareholder's funds are 12,009.72 Cr and total assets amount to 40,981.08 Cr as of March 2025.

As of 14th August, CESC Ltd has a market capitalization of 22,262.96 Cr, categorizing it as a Small Cap company.<BR><BR>In the latest four quarters, CESC reported Net Sales of 18,853.00 Cr and a Net Profit of 1,554.00 Cr.<BR><BR>The latest annual period for the balance sheet is March 2025, with Shareholder's Funds amounting to 12,009.72 Cr and Total Assets of 40,981.08 Cr.

View full answer

When is the next results date for CESC Ltd?

07-Aug-2026

The next results date for CESC Ltd is 13 August 2026.

The next results date for CESC Ltd is scheduled for 13 August 2026.

View full answer

Are CESC Ltd latest results good or bad?

07-May-2026

CESC Ltd's latest Q4 FY26 results show a significant net profit increase of 54.04% quarter-on-quarter, but a decline in operating profit margins to 18.14% raises concerns about operational efficiency. Overall, while profits are up, the margin compression suggests potential challenges ahead.

CESC Ltd's latest results for Q4 FY26 can be viewed as a mixed bag, showcasing both positive and negative aspects. On the positive side, the company reported a consolidated net profit of ₹439 crores, which is a significant increase of 54.04% quarter-on-quarter and 17.69% year-on-year. Additionally, net sales reached ₹4,096 crores, reflecting a modest growth of 2.27% from the previous quarter and a 5.65% increase compared to the same quarter last year.<BR><BR>However, there are concerns regarding operational efficiency. The operating profit margin, excluding other income, decreased to 18.14% from 20.94% a year ago, indicating pressure on costs, particularly in electricity generation and distribution. This margin compression raises questions about the sustainability of profitability improvements moving forward.<BR><BR>Overall, while the surge in net profit is encouraging, the decline in operating margins suggests that CESC is facing challenges in maintaining operational efficiency. Investors may want to consider these factors when evaluating the company's performance.

View full answer

Is CESC technically bullish or bearish?

04-Nov-2025

As of November 3, 2025, the market trend is mildly bullish, supported by daily moving averages and weekly bullish signals, though caution is advised due to mixed monthly indicators and neutral signals from RSI and OBV.

As of 3 November 2025, the technical trend has changed from bullish to mildly bullish. The current stance is mildly bullish, primarily driven by the daily moving averages indicating bullish momentum and the weekly MACD and KST also showing bullish signals. However, the monthly MACD and KST are mildly bearish, suggesting some caution. The Bollinger Bands are mildly bullish on both weekly and monthly time frames, reinforcing the overall positive sentiment. The lack of clear trends in Dow Theory and the neutral signals from RSI and OBV indicate a mixed picture, but the prevailing indicators lean towards a mildly bullish outlook.

View full answer

How has been the historical performance of CESC?

28-Oct-2025

CESC has shown steady growth in financial performance, with net sales increasing from 11,632 Cr in Mar'21 to 17,001 Cr in Mar'25, and total operating income reaching the same figure. Key metrics like operating profit and cash flow have improved, indicating a strong and expanding business despite rising liabilities and debt.

Answer:<BR>The historical performance of CESC shows a steady growth in net sales and operating income over the years, with net sales increasing from 11,632.00 Cr in Mar'21 to 17,001.00 Cr in Mar'25. Total operating income followed a similar trend, rising from 12,159.00 Cr in Mar'20 to 17,001.00 Cr in Mar'25. The total expenditure, excluding depreciation, also grew from 8,465.00 Cr in Mar'21 to 14,312.00 Cr in Mar'25, reflecting the company's expanding operations. Operating profit (PBDIT) increased from 2,126.00 Cr in Mar'24 to 3,063.00 Cr in Mar'25, while profit before tax showed a slight increase from 1,683.00 Cr in Mar'24 to 1,782.00 Cr in Mar'25. Profit after tax remained relatively stable, with a slight decrease from 1,447.00 Cr in Mar'24 to 1,428.00 Cr in Mar'25. The company's total assets rose significantly from 35,457.02 Cr in Mar'20 to 40,981.08 Cr in Mar'25, indicating a strong asset base. Total liabilities also increased, from 35,457.02 Cr in Mar'20 to 40,981.08 Cr in Mar'25, with total debt rising from 10,372.34 Cr in Mar'20 to 15,624.42 Cr in Mar'25. Cash flow from operating activities improved from 2,351.00 Cr in Mar'24 to 2,581.00 Cr in Mar'25, contributing to a net cash inflow of 905.00 Cr in Mar'25.<BR><BR>Breakdown:<BR>CESC's financial performance over the years demonstrates a consistent upward trajectory in key metrics. Net sales surged from 11,632.00 Cr in Mar'21 to 17,001.00 Cr in Mar'25, while total operating income mirrored this growth, reaching 17,001.00 Cr in the same period. The total expenditure also increased, reflecting the company's operational expansion, with a notable rise in operating profit (PBDIT) from 2,126.00 Cr in Mar'24 to 3,063.00 Cr in Mar'25. Despite fluctuations, profit before tax showed resilience, increasing slightly to 1,782.00 Cr in Mar'25. The total assets of CESC grew significantly, indicating a robust financial position, while total liabilities and debt also rose, suggesting increased leverage. The cash flow from operating activities improved, leading to a positive net cash inflow, showcasing the company's ability to generate cash effectively. Overall, CESC's financial metrics reflect a strong and growing business.

View full answer

Is CESC overvalued or undervalued?

21-Oct-2025

As of October 20, 2025, CESC is considered very attractive and undervalued with a PE ratio of 16.38, an EV to EBITDA of 12.38, and a Price to Book Value of 0.19, indicating competitive positioning despite recent underperformance compared to the Sensex, but strong historical returns suggest potential for future growth.

As of 20 October 2025, CESC's valuation grade has moved from attractive to very attractive, indicating a positive shift in its perceived value. The company is currently considered undervalued. Key ratios include a PE ratio of 16.38, an EV to EBITDA of 12.38, and a Price to Book Value of 0.19, which suggest that the stock is trading at a discount compared to its intrinsic value.<BR><BR>In comparison to its peers, CESC's PE ratio is higher than NTPC's 13.85 but significantly lower than Adani Power's 26.45, highlighting its competitive positioning within the industry. Additionally, CESC's EV to EBITDA ratio of 12.38 is more favorable than Adani Power's 17.34, reinforcing its attractiveness. While CESC has underperformed the Sensex year-to-date with a return of -3.58% compared to the Sensex's 7.97%, its strong historical performance over the past three and five years, with returns of 129.97% and 211.62% respectively, suggests potential for recovery and growth moving forward.

View full answer

Who are the top shareholders of the CESC?

17-Jul-2025

The top shareholders of CESC include Rainbow Investments Limited with 44.36%, mutual funds holding 17.51%, Foreign Institutional Investors at 11.01%, and SBI Balanced Advantage Fund as the largest public shareholder with 6.57%. Individual investors collectively own 9.03% of the shares.

The top shareholders of CESC include the promoters, who hold a significant majority of the shares. The promoter with the highest holding is Rainbow Investments Limited, which owns 44.36% of the company. Additionally, mutual funds are represented by 32 schemes, accounting for 17.51% of the shares. Foreign Institutional Investors (FIIs) hold 11.01% through 169 different entities. The highest public shareholder is SBI Balanced Advantage Fund, with a holding of 6.57%. Individual investors collectively hold 9.03% of the shares.

View full answer

Has CESC declared dividend?

06-Jun-2025

CESC Ltd has declared a 450% dividend, amounting to ₹4.5 per share, with an ex-date of January 16, 2025. The company has shown strong total returns over various periods, including a 268.25% total return over the past 5 years.

CESC Ltd has declared a 450% dividend.<BR><BR>Dividend Details:<BR>- Percentage announced: 450%<BR>- Amount per share: 4.5<BR>- Ex-date: Jan-16-2025<BR><BR>Dividend Yield: 2.7%<BR><BR>Total Returns by Period:<BR>In the last 6 months, the price return was -15.95%, the dividend return was 2.25%, resulting in a total return of -13.7%.<BR><BR>Over the past year, the price return was 16.65%, the dividend return was 3.05%, leading to a total return of 19.7%.<BR><BR>In the 2-year period, the price return was 132.92%, with a dividend return of 12.50%, culminating in a total return of 145.42%.<BR><BR>For the 3-year period, the price return was 112.41%, the dividend return was 19.55%, resulting in a total return of 131.96%.<BR><BR>In the last 4 years, the price return was 137.57%, with a dividend return of 23.37%, leading to a total return of 160.94%.<BR><BR>Over the past 5 years, the price return was 169.13%, while the dividend return was 99.12%, resulting in a total return of 268.25%.<BR><BR>Overall, CESC Ltd has declared a significant dividend and has shown strong total returns over various periods, indicating a positive performance trend in both price and dividends.

View full answer
iScoreScore
Click here to find our call on this stock
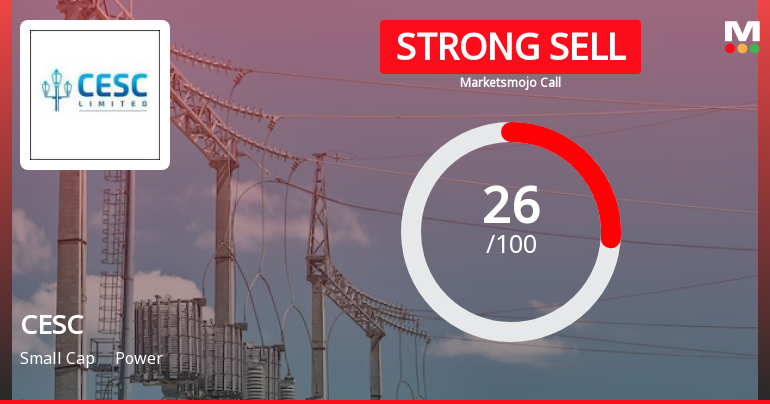
Strong Sell
Sell
Hold
Buy
Strong Buy

Dashboard

1

Weak Long Term Fundamental Strength with a -0.78% CAGR growth in Operating Profits over the last 5 years

  • Low ability to service debt as the company has a high Debt to EBITDA ratio of 6.29 times
  • The company has been able to generate a Return on Capital Employed (avg) of 6.48% signifying low profitability per unit of total capital (equity and debt)
2

Flat results in Jun 26

stock-summaryMojo Parameters

Mojo Parameters

Loading Valuation Snapshot...

Stock DNA

stock-summary
Industry

Power

stock-summary
Market cap

INR 20,430 Cr (Small Cap)

stock-summary
P/E

13.00

stock-summary
Industry P/E

22

stock-summary
Dividend Yield

7.81%

stock-summary
Debt Equity

1.28

stock-summary
Return on Equity

12.28%

stock-summary
Price to Book

1.63

Revenue and Profits:
Net Sales:
5,485 Cr
(Quarterly Results - Jun 2026)
Net Profit:
402 Cr
stock-summaryTotal Returns
Total Returns (Price + Dividend) stock-summary
Dividend Yield (7.81%)
TimePeriod
Price Return
Dividend Return
Total Return
3 Months
-15.71%
3.30%
-12.41%
6 Months
-3.54%
3.79%
0.25%
1 Year
-4.65%
7.69%
3.04%
2 Years
-18.33%
8.52%
-9.81%
3 Years
89.8%
22.84%
112.64%
4 Years
92.77%
31.78%
124.55%
5 Years
103.51%
33.76%
137.27%

Latest dividend: 6 per share ex-dividend date: Aug-19-2026

Risk Adjusted Returns v/s stock-summary
Returns Beta
Icon
Beta has not been calculated since enough price history is not available
stock-summaryNews & Corporate Actions

News

CESC Ltd Falls 7.68%: 5 Key Factors Driving the Weekly Decline

Key Events This Week

17 Aug: Death Cross formation signals bearish trend

17 Aug: Quality rating downgraded to below average

18 Aug: Technical momentum shifts to mildly bearish

20 Aug: Downgrade to Strong Sell amid weak fundamentals

20 Aug: Technical momentum turns outright bearish

Announcements stock-summary

CESC Limited - Updates

09-Dec-2019 | Source : NSE

CESC Limited has informed the Exchange regarding 'We attach herewith a Certificate dated 6 December, 2019 under Regulation 74(5) of SEBI (Depositories and Participants) Regulations, 2018, for the month ended on 30 November, 2019, received from Link Intime India Pvt Ltd., Registrar and Share Transfer Agent of the Company.'.

CESC Limited - Updates

18-Nov-2019 | Source : NSE

CESC Limited has informed the Exchange regarding 'We write to inform you that the Company also functions from its Corporate Office at RPSG House, 2/4, Judges Court Road, Kolkata-700027.

CESC Limited - Demerger

15-Nov-2019 | Source : NSE

CESC Limited has informed the Exchange about updates on Demerger.

Corporate Actions stock-summary

stock-summary
BOARD MEETING

No Upcoming Board Meetings

stock-summary
DIVIDEND

CESC Ltd has declared 600% dividend, ex-date: 19 Aug 26

stock-summary
SPLITS

CESC Ltd has announced 1:10 stock split, ex-date: 17 Sep 21

stock-summary
BONUS

No Bonus history available

stock-summary
RIGHTS

No Rights history available

stock-summaryKey Factors

Quality key factors stock-summary

Factor
Value
Sales Growth (5y)
9.68%
EBIT Growth (5y)
-0.78%
EBIT to Interest (avg)
1.29
Debt to EBITDA (avg)
6.09
Net Debt to Equity (avg)
1.28
Sales to Capital Employed (avg)
0.56
Tax Ratio
24.29%
Dividend Payout Ratio
51.84%
Pledged Shares
0
Institutional Holding
37.62%
ROCE (avg)
6.81%
ROE (avg)
12.22%

Valuation key factors

Factor
Value
P/E Ratio
13
Industry P/E
22
Price to Book Value
1.62
EV to EBIT
16.06
EV to EBITDA
10.45
EV to Capital Employed
1.27
EV to Sales
1.93
PEG Ratio
1.03
Dividend Yield
7.81%
ROCE (Latest)
7.78%
ROE (Latest)
12.28%

Technicals key factors

Indicator
Weekly
Monthly
MACD
Bearish
Mildly Bearish
RSI
No Signal
No Signal
Bollinger Bands
Bearish
Bearish
Moving Averages
Bearish (Daily)
KST
Bearish
Mildly Bearish
Dow Theory
Mildly Bearish
Mildly Bearish
OBV
No Trend
Mildly Bearish
stock-summary Technical Indicator Scale: Bearish, Mildly Bearish, Sideways, Mildly Bullish, Bullish  Turned 
stock-summaryShareholding
Shareholding Snapshot : Jun 2026stock-summary
Shareholding Compare (%holding) stock-summary
Majority shareholders

Promoters

Pledged Promoter Holdings

None

Mutual Funds

Held by 27 Schemes (18.27%)

FIIs

Held by 180 FIIs (11.47%)

Promoter with highest holding

Rainbow Investments Limited (44.36%)

Highest Public shareholder

Sbi Balanced Advantage Fund (7.49%)

Individual Investors Holdings

7.98%

stock-summaryFinancial
[
  {
    "link": "quarterly",
    "btn_text": "All Quarterly Results",
    "header": "Quarterly Results Snapshot (Consolidated) - Jun'26 - QoQ",
    "rhs": [
      {
        "prefix": "Net Sales ",
        "suffix": "QoQ Growth in quarter ended Jun 2026 is 33.91% vs 2.27% in Mar 2026",
        "dir": 1
      },
      {
        "prefix": "Consolidated Net Profit ",
        "suffix": "QoQ Growth in quarter ended Jun 2026 is -8.43% vs 54.04% in Mar 2026",
        "dir": -1
      }
    ],
    "table": {
      "header": [
        "Jun'26",
        "Mar'26",
        "Change(%)"
      ],
      "body": [
        {
          "field": "Net Sales",
          "val1": "5,485.00",
          "val2": "4,096.00",
          "chgp": "33.91%",
          "chgp_class": "positive"
        },
        {
          "field": "Operating Profit (PBDIT) excl Other Income",
          "val1": "895.00",
          "val2": "743.00",
          "chgp": "20.46%",
          "chgp_class": "positive"
        },
        {
          "field": "Interest",
          "val1": "312.00",
          "val2": "317.00",
          "chgp": "-1.58%",
          "chgp_class": "positive"
        },
        {
          "field": "Exceptional Items",
          "val1": "0.00",
          "val2": "0.00",
          "chgp": "",
          "chgp_class": "neutral"
        },
        {
          "field": "Consolidate Net Profit",
          "val1": "402.00",
          "val2": "439.00",
          "chgp": "-8.43%",
          "chgp_class": "negative"
        },
        {
          "field": "Operating Profit Margin (Excl OI)",
          "val1": "16.32%",
          "val2": "18.14%",
          "chgp": "-1.82%",
          "chgp_class": "negative"
        }
      ]
    }
  },
  {
    "link": "half-yearly",
    "btn_text": "All Half Yearly Results",
    "header": "Half Yearly Results Snapshot (Consolidated) - Sep'25",
    "rhs": [
      {
        "prefix": "Net Sales ",
        "suffix": " Growth in half year ended Sep 2025 is 9.47% vs 10.40% in Sep 2024",
        "dir": -1
      },
      {
        "prefix": "Consolidated Net Profit ",
        "suffix": " Growth in half year ended Sep 2025 is 11.08% vs 5.18% in Sep 2024",
        "dir": 1
      }
    ],
    "table": {
      "header": [
        "Sep'25",
        "Sep'24",
        "Change(%)"
      ],
      "body": [
        {
          "field": "Net Sales",
          "val1": "10,469.00",
          "val2": "9,563.00",
          "chgp": "9.47%",
          "chgp_class": "positive"
        },
        {
          "field": "Operating Profit (PBDIT) excl Other Income",
          "val1": "1,925.00",
          "val2": "1,267.00",
          "chgp": "51.93%",
          "chgp_class": "positive"
        },
        {
          "field": "Interest",
          "val1": "700.00",
          "val2": "650.00",
          "chgp": "7.69%",
          "chgp_class": "negative"
        },
        {
          "field": "Exceptional Items",
          "val1": "0.00",
          "val2": "0.00",
          "chgp": "",
          "chgp_class": "neutral"
        },
        {
          "field": "Consolidate Net Profit",
          "val1": "812.00",
          "val2": "731.00",
          "chgp": "11.08%",
          "chgp_class": "positive"
        },
        {
          "field": "Operating Profit Margin (Excl OI)",
          "val1": "18.39%",
          "val2": "13.25%",
          "chgp": "5.14%",
          "chgp_class": "positive"
        }
      ]
    }
  },
  {
    "link": "nine-monthly",
    "btn_text": "All Nine Monthly Results",
    "header": "Nine Monthly Results Snapshot (Consolidated) - Dec'25",
    "rhs": [
      {
        "prefix": "Net Sales ",
        "suffix": "YoY Growth in nine months ended Dec 2025 is 10.29% vs 10.23% in Dec 2024",
        "dir": 1
      },
      {
        "prefix": "Consolidated Net Profit ",
        "suffix": "YoY Growth in nine months ended Dec 2025 is 10.14% vs 2.05% in Dec 2024",
        "dir": 1
      }
    ],
    "table": {
      "header": [
        "Dec'25",
        "Dec'24",
        "Change(%)"
      ],
      "body": [
        {
          "field": "Net Sales",
          "val1": "14,474.00",
          "val2": "13,124.00",
          "chgp": "10.29%",
          "chgp_class": "positive"
        },
        {
          "field": "Operating Profit (PBDIT) excl Other Income",
          "val1": "2,704.00",
          "val2": "1,877.00",
          "chgp": "44.06%",
          "chgp_class": "positive"
        },
        {
          "field": "Interest",
          "val1": "1,043.00",
          "val2": "989.00",
          "chgp": "5.46%",
          "chgp_class": "negative"
        },
        {
          "field": "Exceptional Items",
          "val1": "0.00",
          "val2": "0.00",
          "chgp": "",
          "chgp_class": "neutral"
        },
        {
          "field": "Consolidate Net Profit",
          "val1": "1,097.00",
          "val2": "996.00",
          "chgp": "10.14%",
          "chgp_class": "positive"
        },
        {
          "field": "Operating Profit Margin (Excl OI)",
          "val1": "18.68%",
          "val2": "14.30%",
          "chgp": "4.38%",
          "chgp_class": "positive"
        }
      ]
    }
  },
  {
    "link": "annual",
    "btn_text": "All Annual Results",
    "header": "Annual Results Snapshot (Consolidated) - Mar'26",
    "rhs": [
      {
        "prefix": "Net Sales ",
        "suffix": "YoY Growth in year ended Mar 2026 is 9.23% vs 11.17% in Mar 2025",
        "dir": -1
      },
      {
        "prefix": "Consolidated Net Profit ",
        "suffix": "YoY Growth in year ended Mar 2026 is 12.64% vs -0.51% in Mar 2025",
        "dir": 1
      }
    ],
    "table": {
      "header": [
        "Mar'26",
        "Mar'25",
        "Change(%)"
      ],
      "body": [
        {
          "field": "Net Sales",
          "val1": "18,570.00",
          "val2": "17,001.00",
          "chgp": "9.23%",
          "chgp_class": "positive"
        },
        {
          "field": "Operating Profit (PBDIT) excl Other Income",
          "val1": "3,447.00",
          "val2": "2,689.00",
          "chgp": "28.19%",
          "chgp_class": "positive"
        },
        {
          "field": "Interest",
          "val1": "1,360.00",
          "val2": "1,324.00",
          "chgp": "2.72%",
          "chgp_class": "negative"
        },
        {
          "field": "Exceptional Items",
          "val1": "0.00",
          "val2": "0.00",
          "chgp": "",
          "chgp_class": "neutral"
        },
        {
          "field": "Consolidate Net Profit",
          "val1": "1,542.00",
          "val2": "1,369.00",
          "chgp": "12.64%",
          "chgp_class": "positive"
        },
        {
          "field": "Operating Profit Margin (Excl OI)",
          "val1": "18.56%",
          "val2": "15.82%",
          "chgp": "2.74%",
          "chgp_class": "positive"
        }
      ]
    }
  }
]

Quarterly Results Snapshot (Consolidated) - Jun'26 - QoQstock-summary

Jun'26
Mar'26
Change(%)
Net Sales
5,485.00
4,096.00
33.91%
Operating Profit (PBDIT) excl Other Income
895.00
743.00
20.46%
Interest
312.00
317.00
-1.58%
Exceptional Items
0.00
0.00
Consolidate Net Profit
402.00
439.00
-8.43%
Operating Profit Margin (Excl OI)
16.32%
18.14%
-1.82%
Values in Rs Cr.
Direction Arrows
Net Sales

QoQ Growth in quarter ended Jun 2026 is 33.91% vs 2.27% in Mar 2026

Direction Arrows
Consolidated Net Profit

QoQ Growth in quarter ended Jun 2026 is -8.43% vs 54.04% in Mar 2026

Half Yearly Results Snapshot (Consolidated) - Sep'25stock-summary

Sep'25
Sep'24
Change(%)
Net Sales
10,469.00
9,563.00
9.47%
Operating Profit (PBDIT) excl Other Income
1,925.00
1,267.00
51.93%
Interest
700.00
650.00
7.69%
Exceptional Items
0.00
0.00
Consolidate Net Profit
812.00
731.00
11.08%
Operating Profit Margin (Excl OI)
18.39%
13.25%
5.14%
Values in Rs Cr.
Direction Arrows
Net Sales

Growth in half year ended Sep 2025 is 9.47% vs 10.40% in Sep 2024

Direction Arrows
Consolidated Net Profit

Growth in half year ended Sep 2025 is 11.08% vs 5.18% in Sep 2024

Nine Monthly Results Snapshot (Consolidated) - Dec'25stock-summary

Dec'25
Dec'24
Change(%)
Net Sales
14,474.00
13,124.00
10.29%
Operating Profit (PBDIT) excl Other Income
2,704.00
1,877.00
44.06%
Interest
1,043.00
989.00
5.46%
Exceptional Items
0.00
0.00
Consolidate Net Profit
1,097.00
996.00
10.14%
Operating Profit Margin (Excl OI)
18.68%
14.30%
4.38%
Values in Rs Cr.
Direction Arrows
Net Sales

YoY Growth in nine months ended Dec 2025 is 10.29% vs 10.23% in Dec 2024

Direction Arrows
Consolidated Net Profit

YoY Growth in nine months ended Dec 2025 is 10.14% vs 2.05% in Dec 2024

Annual Results Snapshot (Consolidated) - Mar'26stock-summary

Mar'26
Mar'25
Change(%)
Net Sales
18,570.00
17,001.00
9.23%
Operating Profit (PBDIT) excl Other Income
3,447.00
2,689.00
28.19%
Interest
1,360.00
1,324.00
2.72%
Exceptional Items
0.00
0.00
Consolidate Net Profit
1,542.00
1,369.00
12.64%
Operating Profit Margin (Excl OI)
18.56%
15.82%
2.74%
Values in Rs Cr.
Direction Arrows
Net Sales

YoY Growth in year ended Mar 2026 is 9.23% vs 11.17% in Mar 2025

Direction Arrows
Consolidated Net Profit

YoY Growth in year ended Mar 2026 is 12.64% vs -0.51% in Mar 2025

stock-summaryCompany CV
About CESC Ltd stock-summary
stock-summary
CESC Ltd
Small Cap
Power
CESC Limited was incorporated on March 28, 1978 as 'The Calcutta Electric Supply Corporation (India) Limited'. In 1983, the Company commissioned the Titagarh generating station, with a capacity of 240 MW, which marked the beginning to solve the state's power shortage and as a result of this, the name of the Company was changed to CESC Limited In January, 1987. CESC Limited is a flagship company of the RP-Sanjiv Goenka Group.
Company Coordinates stock-summary
Company Details
CESC House, Chowringhee Square Kolkata West Bengal : 700001
stock-summary
Tel: 91-33-22256040
stock-summary
secretarial@rp-sg.in
Registrar Details
Link Intime India Pvt Ltd, 59 C , Chowringhee Road, 3rd Floor, Kolkata