Epic Energy

  • Market Cap: Micro Cap
  • Industry: Non Banking Financial Company (NBFC)
  • ISIN: INE932F01015
  • NSEID:
  • BSEID: 530407
INR
31.97
-0.02 (-0.06%)
BSENSE

Sep 18, 03:30 PM

BSE+NSE Vol: 2.54 k

  • Price Points
  • Score
  • Mojo Parameters
  • Total Return
  • News and Corporate Actions
  • Key factors
  • Shareholding
  • Financials
  • CompanyCV
stock-summaryPrice Point
High/Low

1Day

52 Week

Valuation
Technical
Day's Volume

CASH

2.54 k (8.34%) Volume

Shareholding (Jun 2026)

FII

0.00%

Held by 0 FIIs

DII

0.00%

Held by 0 DIIs

Promoter

26.16%

Why is Epic Energy Ltd falling/rising?

06-Sep-2026

As of 05-Sep, Epic Energy Ltd's stock price is falling at 32.88, down -0.06%. The stock has declined -1.74% over the last two days and is trading below all key moving averages, indicating a bearish trend and decreased investor confidence.

As of 05-Sep, Epic Energy Ltd's stock price is falling, currently at 32.88, reflecting a change of -0.02 (-0.06%). The stock has been on a downward trend, having lost value for the last two days with a total decline of -1.74% during this period. Additionally, the stock is trading below its 5-day, 20-day, 50-day, 100-day, and 200-day moving averages, indicating a bearish trend.<BR><BR>Investor participation has also decreased, as evidenced by a significant drop in delivery volume, which fell by -48.65% compared to the 5-day average. This decline in trading activity suggests a lack of confidence among investors. Furthermore, the stock's year-to-date performance shows a substantial decline of -23.34%, which is significantly worse than the benchmark Sensex's decline of -10.21% over the same period. Overall, these factors contribute to the ongoing decline in Epic Energy Ltd's stock price.

View full answer

Who are in the management team of Epic Energy?

01-Sep-2026

The management team of Epic Energy includes Sanjay Gugale (Independent Director), Veena Morsawala (Non-Executive Director), Brian A D'Souza (Independent Director), Sandeep Shivkumar Gupta (Company Secretary & Compliance Officer), and Bharat Mehta (Independent Director).

The management team of Epic Energy includes the following individuals:<BR><BR>1. Sanjay Gugale - Independent Director<BR>2. Veena Morsawala - Non Executive Director<BR>3. Brian A D'Souza - Independent Director<BR>4. Sandeep Shivkumar Gupta - Company Secretary & Compliance Officer<BR>5. Bharat Mehta - Independent Director<BR><BR>If you need more details about their roles or responsibilities, feel free to ask!

View full answer

What does Epic Energy do?

01-Sep-2026

Epic Energy Ltd is a micro-cap NBFC specializing in energy conservation and renewable energy services, with a market cap of INR 27 Cr and reported net sales of 2 Cr for June 2026. The company has a P/E ratio of 42.00 and a return on equity of 8.03%.

Overview:<BR>Epic Energy Ltd is a micro-cap company operating in the Non Banking Financial Company (NBFC) sector, specializing in energy conservation and renewable energy services.<BR><BR>History:<BR>Epic Energy Limited was incorporated in 1991 and has been engaged in its current business since 2004. The latest quarterly results reported net sales and profit for June 2026.<BR><BR>Financial Snapshot:<BR>Net Sales: 2 Cr (Quarterly Results - Jun 2026) <BR>Net Profit: 0 Cr (Quarterly Results - Jun 2026) <BR>Market Cap: INR 27 Cr (Micro Cap)<BR><BR>Key Metrics:<BR>P/E: 42.00 <BR>Industry P/E: 28 <BR>Dividend Yield: 0.00% <BR>Debt Equity: -0.01 <BR>Return on Equity: 8.03% <BR>Price to Book: 3.15 <BR><BR>Contact Details:<BR>Address: Sai Pooja Apartment Office No 2, Plot No 374 Sector 19 C Navi Mumbai Maharashtra : 400709 <BR>Email: info@epicenergy.biz <BR>Website: http://www.epicenergy.biz

View full answer

Who are the peers of the Epic Energy?

01-Sep-2026

Epic Energy's peers include Stanrose Mafat., Sulabh Engineers, Libord Finance, and Jindal Leasefin, among others. Jindal Leasefin has the highest 1-year return at 110.70%, while Epic Energy's return is -25.28%.

Peers: The peers of Epic Energy are Stanrose Mafat., Sulabh Engineers, Libord Finance, Swarna Securitie, Nalin Lease Fin., Williamson Magor, KJMC Corporate, TCFC Finance, Ramsons Projects, and Jindal Leasefin.<BR><BR>Quality Snapshot: Excellent management risk is observed at Stanrose Mafat., Sulabh Engineers, Nalin Lease Fin., KJMC Corporate, and Jindal Leasefin, while Below Average management risk is found at Epic Energy, Libord Finance, TCFC Finance, and the rest. Average growth is noted at Epic Energy and Ramsons Projects, while Good growth is seen at KJMC Corporate and Jindal Leasefin, with the rest showing Average or Below Average growth. Capital Structure is Excellent for Stanrose Mafat., Sulabh Engineers, Libord Finance, Nalin Lease Fin., KJMC Corporate, and Jindal Leasefin, while Good is noted for Epic Energy, and the rest do not qualify.<BR><BR>Return Snapshot: The peer with the highest 1-year return is Jindal Leasefin at 110.70%, while the lowest is TCFC Finance at -49.40%. Epic Energy's own 1-year return is -25.28%, which is significantly lower than Jindal Leasefin's and higher than TCFC Finance's. Additionally, peers with negative six-month returns include Nalin Lease Fin., Ramsons Projects, and TCFC Finance.

View full answer

How big is Epic Energy?

01-Sep-2026

As of 31st August, Epic Energy Ltd has a market capitalization of 27.00 Cr, with net sales of 6.30 Cr and a net profit of 0.65 Cr reported over the latest four quarters. Specific values for Shareholder's Funds and Total Assets are not available.

As of 31st August, Epic Energy Ltd has a market capitalization of 27.00 Cr, categorizing it as a Micro Cap company.<BR><BR>In the latest four quarters, Epic Energy reported net sales of 6.30 Cr and a net profit of 0.65 Cr.<BR><BR>The reporting period for the balance sheet data is the latest annual period. However, specific values for Shareholder's Funds and Total Assets are not available.

View full answer

Should I buy, sell or hold Epic Energy Ltd?

13-Aug-2026

When is the next results date for Epic Energy Ltd?

07-Aug-2026

The next results date for Epic Energy Ltd is 11 August 2026.

The next results date for Epic Energy Ltd is scheduled for 11 August 2026.

View full answer

Are Epic Energy Ltd latest results good or bad?

30-May-2026

Epic Energy Ltd's latest results show a strong quarterly recovery with a 450% increase in net profit and a 108.89% rise in net sales, but year-on-year comparisons reveal declines of 47.62% in profit and 21.01% in sales, indicating ongoing challenges. Investors should be cautious due to these mixed signals and operational difficulties.

Epic Energy Ltd's latest results present a mixed picture. On one hand, the company reported a significant sequential recovery in net profit, which increased by 450% quarter-on-quarter to ₹0.33 crore, and net sales surged by 108.89% to ₹1.88 crore. This indicates a positive trend in the short term.<BR><BR>However, when looking at the year-on-year performance, the situation is less favorable. Both net profit and net sales have declined compared to the same quarter last year, with net profit down 47.62% and net sales down 21.01%. This suggests that while there was a recovery from the previous quarter, the company is still struggling to maintain its performance compared to last year.<BR><BR>Additionally, the operating margin has significantly decreased from previous levels, indicating potential challenges in cost management or competitive pressures. The overall volatility in sales figures over the past quarters raises concerns about the sustainability of this recovery.<BR><BR>In summary, while the recent quarterly results show improvement from the previous quarter, the year-on-year declines and ongoing operational challenges suggest that the company's overall performance remains concerning. Investors should be cautious given these mixed signals and the broader context of the company's struggles within the NBFC sector.

View full answer

How has been the historical performance of Epic Energy?

12-Nov-2025

Epic Energy has experienced a significant decline in net sales and profits from 2012 to 2025, but recent periods show signs of recovery, with improved profit margins and earnings per share. Despite historical challenges, the company is demonstrating a more efficient cost structure and potential for profitability growth.

Answer:<BR>The historical performance of Epic Energy shows a significant decline in net sales and profits over the years, with a notable recovery in recent periods.<BR><BR>Breakdown:<BR>Epic Energy's net sales have decreased from 64.90 Cr in Mar'12 to just 4.26 Cr in Mar'25, indicating a substantial decline in revenue generation. Operating income followed a similar trend, dropping from 64.90 Cr in Mar'12 to 4.26 Cr in Mar'25. The total expenditure, excluding depreciation, also decreased from 58.04 Cr in Mar'12 to 2.91 Cr in Mar'25, reflecting a reduction in operational costs. Operating profit (PBDIT) has seen a decline from 10.17 Cr in Mar'10 to 1.35 Cr in Mar'25, although it has shown improvement from 0.49 Cr in Mar'24. Profit before tax and profit after tax have also decreased significantly, with profit after tax falling from 5.62 Cr in Mar'10 to 1.29 Cr in Mar'25. However, the profit after tax margin has improved to 30.28% in Mar'25 from 11.69% in Mar'24, suggesting a more efficient cost structure in recent years. The earnings per share (EPS) have also increased to 1.82 in Mar'25 from 0.50 in Mar'24, indicating a positive trend in profitability per share. Overall, while Epic Energy has faced challenges in revenue and profit generation over the years, recent results indicate a potential recovery in profitability metrics.

View full answer

Who are the top shareholders of the Epic Energy?

17-Jul-2025

The top shareholders of Epic Energy include individual investors holding 69.86% of shares, with Behram Burjor Mehta as the largest public shareholder at 13.87% and promoter Morsawala Veena Nikhil holding 11.65%. There are no institutional or pledged promoter holdings reported.

The top shareholders of Epic Energy include individual investors who hold a significant portion of the shares, accounting for 69.86% of the total. Among the major shareholders, Behram Burjor Mehta stands out as the highest public shareholder with 13.87%. Additionally, Morsawala Veena Nikhil is the promoter with the highest holding at 11.65%. There are no institutional holdings or pledged promoter holdings reported.

View full answer

Is Epic Energy overvalued or undervalued?

09-Jun-2025

As of July 8, 2024, Epic Energy Ltd. is considered very expensive with a PE ratio of 39.13 and an EV to EBITDA of 38.19, indicating overvaluation compared to its peers and unsustainable growth expectations, despite a remarkable past year return of 484.54% and a year-to-date decline of 40.99%.

As of 8 July 2024, the valuation grade for Epic Energy Ltd. has moved from expensive to very expensive, indicating a significant shift in its perceived value. The company is currently overvalued, with a PE ratio of 39.13, an EV to EBITDA ratio of 38.19, and a Price to Book Value of 6.41. These figures suggest that the market is pricing in high growth expectations that may not be sustainable.<BR><BR>In comparison to its peers, Epic Energy's valuation metrics are notably higher; for instance, its PE ratio of 50.055 and EV to EBITDA of 48.9853 highlight its premium valuation relative to industry standards. Additionally, while the company has shown remarkable returns over the past year at 484.54%, it has underperformed the Sensex with a year-to-date decline of 40.99%. This disparity further reinforces the conclusion that Epic Energy is currently overvalued.

View full answer

What is the technical trend for Epic Energy?

09-Jun-2025

As of May 20, 2025, Epic Energy's technical trend is mildly bullish, supported by the weekly MACD and KST indicators, despite some caution from the monthly MACD and short-term bearish signals from daily moving averages.

As of 20 May 2025, the technical trend for Epic Energy has changed from sideways to mildly bullish. The weekly MACD is bullish, supporting the mildly bullish stance, while the monthly MACD is mildly bearish, indicating some caution. The Bollinger Bands are also mildly bullish on both weekly and monthly time frames, reinforcing the positive outlook. However, the daily moving averages are mildly bearish, suggesting short-term weakness. The KST is bullish on both weekly and monthly time frames, further supporting the overall mildly bullish sentiment. The Dow Theory indicates a mildly bullish trend on the weekly chart, but no trend on the monthly chart. Overall, the current technical stance is mildly bullish, driven primarily by the weekly MACD and KST indicators.

View full answer

Has Epic Energy declared dividend?

06-Jun-2025

Epic Energy Ltd has declared a 7% dividend, amounting to 0.7 per share, with an ex-date of September 20, 2012. However, the dividend yield is 0%, as the company has not consistently paid dividends in recent periods, despite significant price appreciation over time.

Epic Energy Ltd has declared a 7% dividend.<BR><BR>Dividend Details:<BR>- Percentage announced: 7%<BR>- Amount per share: 0.7<BR>- Ex-date: 20 Sep 12<BR><BR>Dividend Yield: 0%<BR><BR>Total Returns by Period:<BR>In the 6-month period, the price return was -47.4%, the dividend return was 0%, resulting in a total return of -47.4%.<BR><BR>For the 1-year period, the price return was 500.52%, the dividend return was 0%, leading to a total return of 500.52%.<BR><BR>Over the 2-year period, the price return was 961.26%, with a dividend return of 0%, resulting in a total return of 961.26%.<BR><BR>In the 3-year period, the price return was 1060.8%, the dividend return was 0%, yielding a total return of 1060.8%.<BR><BR>For the 4-year period, the price return was 1681.49%, with a dividend return of 0%, culminating in a total return of 1681.49%.<BR><BR>In the 5-year period, the price return was 1275.0%, the dividend return was 0%, resulting in a total return of 1275.0%.<BR><BR>Overall, while Epic Energy Ltd has declared a dividend, the dividend yield remains at 0%, indicating that the company has not consistently paid dividends in recent periods. The total returns over various periods show significant price appreciation, particularly over the longer term, despite the lack of dividend payments.

View full answer
iScoreScore
Click here to find our call on this stock
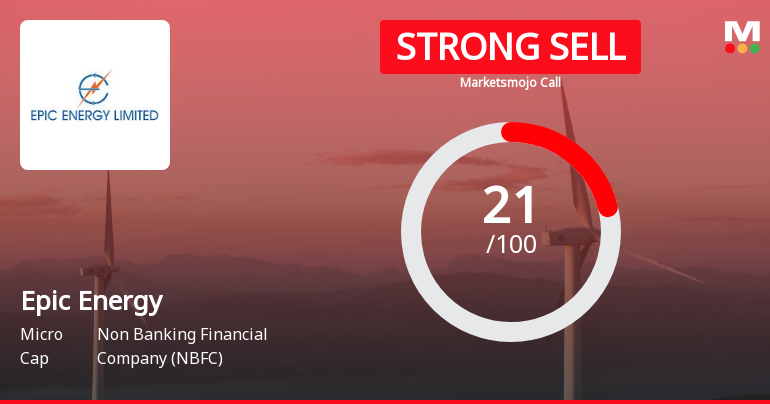
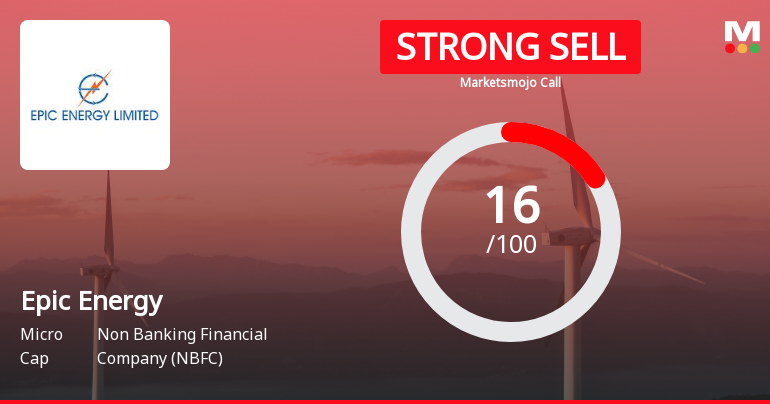
Strong Sell
Sell
Hold
Buy
Strong Buy

Dashboard

1

Weak Long Term Fundamental Strength with an average Return on Equity (ROE) of 7.77%

  • Poor long term growth as Operating profit has grown by an annual rate 19.14% of over the last 5 years
  • Company's ability to service its debt is weak with a poor EBIT to Interest (avg) ratio of 1.02
2

Flat results in Jun 26

3

With ROE of 8, it has a Very Expensive valuation with a 3 Price to Book Value

4

Underperformed the market in the last 1 year

stock-summaryMojo Parameters

Mojo Parameters

Loading Valuation Snapshot...

Stock DNA

stock-summary
Industry

Non Banking Financial Company (NBFC)

stock-summary
Market cap

INR 28 Cr (Micro Cap)

stock-summary
P/E

41.00

stock-summary
Industry P/E

27

stock-summary
Dividend Yield

0.00%

stock-summary
Debt Equity

-0.01

stock-summary
Return on Equity

8.03%

stock-summary
Price to Book

2.99

Revenue and Profits:
Net Sales:
2 Cr
(Quarterly Results - Jun 2026)
Net Profit:
0 Cr
stock-summaryTotal Returns
Total Returns (Price + Dividend) stock-summary
Dividend Yield (0%)
TimePeriod
Price Return
Dividend Return
Total Return
3 Months
-10.32%
0%
-10.32%
6 Months
5.65%
0%
5.65%
1 Year
-38.58%
0%
-38.58%
2 Years
-31.0%
0%
-31.0%
3 Years
350.28%
0%
350.28%
4 Years
294.69%
0%
294.69%
5 Years
605.74%
0%
605.74%

Latest dividend: 0.7 per share ex-dividend date: Sep-20-2012

Risk Adjusted Returns v/s stock-summary
Returns Beta
Icon
Beta has not been calculated since enough price history is not available
stock-summaryNews & Corporate Actions

Announcements stock-summary

Disclosure Under Regulation 30 Of The SEBI (Listing Obligation And Disclosure Requirements) Regulations 2015 - Commencement Of Trial Production At Epic Energy Limiteds Joint Venture Swachcha Urja Nirman LLPs (SUN LLP) Second Life Battery Assembly Plant At

05-Sep-2026 | Source : BSE

Epic Energy Limited is pleased to announce that its Joint Venture Swachcha Urja Nirman LLP has commenced Trial Production at its Second Life Battery Assembly Plant located at Wada Maharashtra with effect from September 5 2026.

Reg. 34 (1) Annual Report.

31-Aug-2026 | Source : BSE

The Annual Report for the Financial Year 2025-26 along with notice of 35th Annual General Meeting.

Notice Convening The 35Th Annual General Meeting Of The Company For The Financial Year 2025-26

31-Aug-2026 | Source : BSE

35th Annual General Meeting (AGM) of the company is scheduled to be held on Tuesday 22 September 2026 at 11:00 am (IST) through Video-Conferencing/Other Audio-Visual Means. The Copy of the AGM Notice is enclosed.

Corporate Actions stock-summary

stock-summary
BOARD MEETING

No Upcoming Board Meetings

stock-summary
DIVIDEND

Epic Energy Ltd has declared 7% dividend, ex-date: 20 Sep 12

stock-summary
SPLITS

No Splits history available

stock-summary
BONUS

No Bonus history available

stock-summary
RIGHTS

No Rights history available

stock-summaryKey Factors

Quality key factors stock-summary

Factor
Value
Sales Growth (5y)
32.41%
EBIT Growth (5y)
19.14%
EBIT to Interest (avg)
1.02
Debt to EBITDA (avg)
Net Debt is too low
Net Debt to Equity (avg)
-0.01
Sales to Capital Employed (avg)
0.36
Tax Ratio
Tax Ratio is Negative%
Dividend Payout Ratio
0
Pledged Shares
0
Institutional Holding
0
ROCE (avg)
1.29%
ROE (avg)
7.77%

Valuation key factors

Factor
Value
P/E Ratio
41
Industry P/E
27
Price to Book Value
3.03
EV to EBIT
26.37
EV to EBITDA
26.37
EV to Capital Employed
3.05
EV to Sales
4.19
PEG Ratio
NA
Dividend Yield
NA
ROCE (Latest)
8.56%
ROE (Latest)
8.03%

Technicals key factors

Indicator
Weekly
Monthly
MACD
Bearish
Bearish
RSI
No Signal
No Signal
Bollinger Bands
Bearish
Bearish
Moving Averages
Bearish (Daily)
KST
Bearish
Mildly Bearish
Dow Theory
Mildly Bearish
Mildly Bearish
stock-summary Technical Indicator Scale: Bearish, Mildly Bearish, Sideways, Mildly Bullish, Bullish  Turned 
stock-summaryShareholding
Shareholding Snapshot : Jun 2026stock-summary
Shareholding Compare (%holding) stock-summary
Majority shareholders

Non Institution

Pledged Promoter Holdings

None

Mutual Funds

Held by 0 Schemes

FIIs

Held by 0 FIIs

Promoter with highest holding

Morsawala Veena Nikhil (13.09%)

Highest Public shareholder

Behram Burjor Mehta (12.59%)

Individual Investors Holdings

65.28%

stock-summaryFinancial
[
  {
    "link": "quarterly",
    "btn_text": "All Quarterly Results",
    "header": "Quarterly Results Snapshot (Consolidated) - Jun'26 - QoQ",
    "rhs": [
      {
        "prefix": "Net Sales ",
        "suffix": "QoQ Growth in quarter ended Jun 2026 is 32.45% vs 108.89% in Mar 2026",
        "dir": -1
      },
      {
        "prefix": "Consolidated Net Profit ",
        "suffix": "QoQ Growth in quarter ended Jun 2026 is -93.94% vs 450.00% in Mar 2026",
        "dir": -1
      }
    ],
    "table": {
      "header": [
        "Jun'26",
        "Mar'26",
        "Change(%)"
      ],
      "body": [
        {
          "field": "Net Sales",
          "val1": "2.49",
          "val2": "1.88",
          "chgp": "32.45%",
          "chgp_class": "positive"
        },
        {
          "field": "Operating Profit (PBDIT) excl Other Income",
          "val1": "0.04",
          "val2": "0.34",
          "chgp": "-88.24%",
          "chgp_class": "negative"
        },
        {
          "field": "Interest",
          "val1": "0.01",
          "val2": "0.01",
          "chgp": "",
          "chgp_class": "neutral"
        },
        {
          "field": "Exceptional Items",
          "val1": "0.00",
          "val2": "0.00",
          "chgp": "",
          "chgp_class": "neutral"
        },
        {
          "field": "Consolidate Net Profit",
          "val1": "0.02",
          "val2": "0.33",
          "chgp": "-93.94%",
          "chgp_class": "negative"
        },
        {
          "field": "Operating Profit Margin (Excl OI)",
          "val1": "1.61%",
          "val2": "18.09%",
          "chgp": "-16.48%",
          "chgp_class": "negative"
        }
      ]
    }
  },
  {
    "link": "half-yearly",
    "btn_text": "All Half Yearly Results",
    "header": "Half Yearly Results Snapshot (Consolidated) - Sep'25",
    "rhs": [
      {
        "prefix": "Net Sales ",
        "suffix": "Not Applicable: The company has declared_date for only one period",
        "dir": 0
      },
      {
        "prefix": "Consolidated Net Profit ",
        "suffix": "Not Applicable: The company has declared_date for only one period",
        "dir": 0
      }
    ],
    "table": {
      "header": [
        "Sep'25",
        "Sep'24",
        "Change(%)"
      ],
      "body": [
        {
          "field": "Net Sales",
          "val1": "2.09",
          "val2": "1.33",
          "chgp": "57.14%",
          "chgp_class": "positive"
        },
        {
          "field": "Operating Profit (PBDIT) excl Other Income",
          "val1": "0.36",
          "val2": "0.56",
          "chgp": "-35.71%",
          "chgp_class": "negative"
        },
        {
          "field": "Interest",
          "val1": "0.02",
          "val2": "0.00",
          "chgp": "",
          "chgp_class": "neutral"
        },
        {
          "field": "Exceptional Items",
          "val1": "0.00",
          "val2": "0.00",
          "chgp": "",
          "chgp_class": "neutral"
        },
        {
          "field": "Consolidate Net Profit",
          "val1": "0.31",
          "val2": "0.49",
          "chgp": "-36.73%",
          "chgp_class": "negative"
        },
        {
          "field": "Operating Profit Margin (Excl OI)",
          "val1": "17.22%",
          "val2": "42.11%",
          "chgp": "-24.89%",
          "chgp_class": "negative"
        }
      ]
    }
  },
  {
    "link": "nine-monthly",
    "btn_text": "All Nine Monthly Results",
    "header": "Nine Monthly Results Snapshot (Consolidated) - Dec'25",
    "rhs": [
      {
        "prefix": "Net Sales ",
        "suffix": "Not Applicable: The company has declared_date for only one period",
        "dir": 0
      },
      {
        "prefix": "Consolidated Net Profit ",
        "suffix": "Not Applicable: The company has declared_date for only one period",
        "dir": 0
      }
    ],
    "table": {
      "header": [
        "Dec'25",
        "Dec'24",
        "Change(%)"
      ],
      "body": [
        {
          "field": "Net Sales",
          "val1": "2.99",
          "val2": "1.88",
          "chgp": "59.04%",
          "chgp_class": "positive"
        },
        {
          "field": "Operating Profit (PBDIT) excl Other Income",
          "val1": "0.44",
          "val2": "0.76",
          "chgp": "-42.11%",
          "chgp_class": "negative"
        },
        {
          "field": "Interest",
          "val1": "0.03",
          "val2": "0.00",
          "chgp": "",
          "chgp_class": "neutral"
        },
        {
          "field": "Exceptional Items",
          "val1": "0.00",
          "val2": "0.00",
          "chgp": "",
          "chgp_class": "neutral"
        },
        {
          "field": "Consolidate Net Profit",
          "val1": "0.37",
          "val2": "0.66",
          "chgp": "-43.94%",
          "chgp_class": "negative"
        },
        {
          "field": "Operating Profit Margin (Excl OI)",
          "val1": "14.72%",
          "val2": "40.43%",
          "chgp": "-25.71%",
          "chgp_class": "negative"
        }
      ]
    }
  },
  {
    "link": "annual",
    "btn_text": "All Annual Results",
    "header": "Annual Results Snapshot (Consolidated) - Mar'26",
    "rhs": [
      {
        "prefix": "Net Sales ",
        "suffix": "YoY Growth in year ended Mar 2026 is 14.32% vs 38.31% in Mar 2025",
        "dir": -1
      },
      {
        "prefix": "Consolidated Net Profit ",
        "suffix": "YoY Growth in year ended Mar 2026 is -47.33% vs 263.89% in Mar 2025",
        "dir": -1
      }
    ],
    "table": {
      "header": [
        "Mar'26",
        "Mar'25",
        "Change(%)"
      ],
      "body": [
        {
          "field": "Net Sales",
          "val1": "4.87",
          "val2": "4.26",
          "chgp": "14.32%",
          "chgp_class": "positive"
        },
        {
          "field": "Operating Profit (PBDIT) excl Other Income",
          "val1": "0.79",
          "val2": "1.35",
          "chgp": "-41.48%",
          "chgp_class": "negative"
        },
        {
          "field": "Interest",
          "val1": "0.05",
          "val2": "0.00",
          "chgp": "",
          "chgp_class": "neutral"
        },
        {
          "field": "Exceptional Items",
          "val1": "0.00",
          "val2": "0.00",
          "chgp": "",
          "chgp_class": "neutral"
        },
        {
          "field": "Consolidate Net Profit",
          "val1": "0.69",
          "val2": "1.31",
          "chgp": "-47.33%",
          "chgp_class": "negative"
        },
        {
          "field": "Operating Profit Margin (Excl OI)",
          "val1": "16.22%",
          "val2": "31.69%",
          "chgp": "-15.47%",
          "chgp_class": "negative"
        }
      ]
    }
  }
]

Quarterly Results Snapshot (Consolidated) - Jun'26 - QoQstock-summary

Jun'26
Mar'26
Change(%)
Net Sales
2.49
1.88
32.45%
Operating Profit (PBDIT) excl Other Income
0.04
0.34
-88.24%
Interest
0.01
0.01
Exceptional Items
0.00
0.00
Consolidate Net Profit
0.02
0.33
-93.94%
Operating Profit Margin (Excl OI)
1.61%
18.09%
-16.48%
Values in Rs Cr.
Direction Arrows
Net Sales

QoQ Growth in quarter ended Jun 2026 is 32.45% vs 108.89% in Mar 2026

Direction Arrows
Consolidated Net Profit

QoQ Growth in quarter ended Jun 2026 is -93.94% vs 450.00% in Mar 2026

Half Yearly Results Snapshot (Consolidated) - Sep'25stock-summary

Sep'25
Sep'24
Change(%)
Net Sales
2.09
1.33
57.14%
Operating Profit (PBDIT) excl Other Income
0.36
0.56
-35.71%
Interest
0.02
0.00
Exceptional Items
0.00
0.00
Consolidate Net Profit
0.31
0.49
-36.73%
Operating Profit Margin (Excl OI)
17.22%
42.11%
-24.89%
Values in Rs Cr.
Net Sales

Not Applicable: The company has declared_date for only one period

Consolidated Net Profit

Not Applicable: The company has declared_date for only one period

Nine Monthly Results Snapshot (Consolidated) - Dec'25stock-summary

Dec'25
Dec'24
Change(%)
Net Sales
2.99
1.88
59.04%
Operating Profit (PBDIT) excl Other Income
0.44
0.76
-42.11%
Interest
0.03
0.00
Exceptional Items
0.00
0.00
Consolidate Net Profit
0.37
0.66
-43.94%
Operating Profit Margin (Excl OI)
14.72%
40.43%
-25.71%
Values in Rs Cr.
Net Sales

Not Applicable: The company has declared_date for only one period

Consolidated Net Profit

Not Applicable: The company has declared_date for only one period

Annual Results Snapshot (Consolidated) - Mar'26stock-summary

Mar'26
Mar'25
Change(%)
Net Sales
4.87
4.26
14.32%
Operating Profit (PBDIT) excl Other Income
0.79
1.35
-41.48%
Interest
0.05
0.00
Exceptional Items
0.00
0.00
Consolidate Net Profit
0.69
1.31
-47.33%
Operating Profit Margin (Excl OI)
16.22%
31.69%
-15.47%
Values in Rs Cr.
Direction Arrows
Net Sales

YoY Growth in year ended Mar 2026 is 14.32% vs 38.31% in Mar 2025

Direction Arrows
Consolidated Net Profit

YoY Growth in year ended Mar 2026 is -47.33% vs 263.89% in Mar 2025

stock-summaryCompany CV
About Epic Energy Ltd stock-summary
stock-summary
Epic Energy Ltd
Micro Cap
Non Banking Financial Company (NBFC)
Epic Energy Limited was incorporated in 1991. The Company has been in the business of Energy conservation and Renewable Energy Services since 2004. It basically operates in two business segments: Power conditioners and savers, and Renewable Energy and energy saving appliances.
Company Coordinates stock-summary
Company Details
Sai Pooja Aparment Office No 2, Plot No 374 Sector 19 C Navi Mumbai Maharashtra : 400709
stock-summary
Tel:
stock-summary
info@epicenergy.biz
Registrar Details
Adroit Corporate Services Pvt Ltd, 17-20 Jaferbhoy Industrial Estate , 1st Floor, Makwana Road, Marol Naka, Mumbai