
Compare IndiaNivesh with Similar Stocks
Stock DNA
Non Banking Financial Company (NBFC)
INR 26 Cr (Micro Cap)
NA (Loss Making)
21
0.00%
-2.84
18.19%
-0.53
Total Returns (Price + Dividend) 
Latest dividend: 0.1 per share ex-dividend date: Sep-19-2018
Risk Adjusted Returns v/s
Returns Beta

News

IndiaNivesh Ltd is Rated Strong Sell
IndiaNivesh Ltd is rated Strong Sell by MarketsMOJO, with this rating last updated on 10 Feb 2025. However, the analysis and financial metrics presented here reflect the company’s current position as of 10 July 2026, providing investors with an up-to-date view of its fundamentals, valuation, financial trends, and technical outlook.
Read full news articleAre IndiaNivesh Ltd latest results good or bad?
IndiaNivesh Ltd's latest financial results for Q4 FY26 indicate significant operational challenges. The company reported net sales of just ₹0.06 crores, a substantial decline of 96.76% from the previous quarter and a 60.00% drop year-on-year. This sharp decrease in revenue reflects ongoing operational weakness rather than a temporary setback. The net loss for the quarter amounted to ₹10.85 crores, which is a considerable deterioration compared to the previous quarter. The operating margin fell to negative 1816.67%, highlighting a severe misalignment between the company's cost structure and its revenue-generating capacity. Additionally, interest expenses surged dramatically to ₹9.06 crores, indicating potential structural issues within the company's financial management. The balance sheet shows distress, with negative shareholder funds of ₹40.50 crores and a negative book value of ₹13.82 per share. This ra...
Read full news article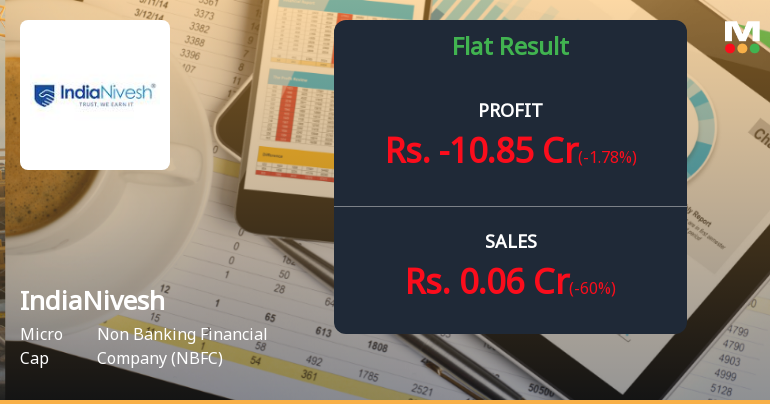
IndiaNivesh Q4 FY26: Mounting Losses Signal Deepening Financial Distress
IndiaNivesh Limited, a micro-cap non-banking financial company with a market capitalisation of ₹28.00 crores, reported alarming fourth-quarter results for FY26 that underscore mounting financial challenges. The company posted a net loss of ₹10.85 crores in Q4 FY26, representing a staggering 696.15% deterioration from the previous quarter's profit of ₹1.82 crores. On a year-on-year basis, losses marginally increased by 1.78% from ₹10.66 crores in Q4 FY25. The stock closed at ₹7.61 on June 01, 2026, down 35.51% from its 52-week high of ₹11.80, reflecting persistent investor concerns about the company's deteriorating financial health.
Read full news article Announcements
Compliances-Certificate under Reg. 74 (5) of SEBI (DP) Regulations 2018
14-Jul-2026 | Source : BSECertificate under Reg.74(5) of SEBI (DP) Regulations 2018 for the first quarter ended 30th June 2026
Closure of Trading Window
29-Jun-2026 | Source : BSEWe hereby submit the intimation towards the closure of trading of window for the quarter ended 30th June 2026
Announcement under Regulation 30 (LODR)-Newspaper Publication
01-Jun-2026 | Source : BSERegulation 30 and 47(3) of SEBI (LODR) regulation 2015 in Relation to Financial Result of Financial Year ended 31st March 2026
Corporate Actions

No Upcoming Board Meetings

IndiaNivesh Ltd has declared 10% dividend, ex-date: 19 Sep 18

IndiaNivesh Ltd has announced 1:10 stock split, ex-date: 18 Apr 12

No Bonus history available

No Rights history available
Quality key factors
Valuation key factors
Technicals key factors
 Technical Indicator Scale: Bearish, Mildly Bearish, Sideways, Mildly Bullish, Bullish Turned
 Shareholding Snapshot : Mar 2026
Shareholding Compare (%holding)
Promoters
None
Held by 0 Schemes
Held by 0 FIIs
Sneh Shares & Securities Private Limited (44.38%)
Bright Impex & Agencies Private Limited (8.83%)
16.3%
Quarterly Results Snapshot (Consolidated) - Mar'26 - YoY

YoY Growth in quarter ended Mar 2026 is -60.00% vs -71.15% in Mar 2025
YoY Growth in quarter ended Mar 2026 is -1.78% vs -367.54% in Mar 2025
Half Yearly Results Snapshot (Consolidated) - Sep'25

Growth in half year ended Sep 2025 is -98.80% vs 4.39% in Sep 2024
Growth in half year ended Sep 2025 is -99.44% vs 25.35% in Sep 2024
Nine Monthly Results Snapshot (Consolidated) - Dec'25
YoY Growth in nine months ended Dec 2025 is -50.78% vs -31.55% in Dec 2024
YoY Growth in nine months ended Dec 2025 is -56.91% vs -11.23% in Dec 2024
Annual Results Snapshot (Consolidated) - Mar'26
YoY Growth in year ended Mar 2026 is -50.88% vs -34.91% in Mar 2025
YoY Growth in year ended Mar 2026 is -41.00% vs -352.57% in Mar 2025
About IndiaNivesh Ltd

Company Coordinates


