
Compare Tera Software with Similar Stocks
Dashboard
Strong ability to service debt as the company has a low Debt to EBITDA ratio of 1.07 times
With a growth in Net Sales of 26.38%, the company declared Very Positive results in Mar 26
With ROCE of 20, it has a Very Attractive valuation with a 3.1 Enterprise value to Capital Employed
Despite the size of the company, domestic mutual funds hold only 0% of the company
Consistent Returns over the last 3 years
Stock DNA
Computers - Software & Consulting
INR 528 Cr (Micro Cap)
21.00
20
0.24%
0.23
16.99%
3.64
Total Returns (Price + Dividend) 
Latest dividend: 1 per share ex-dividend date: Sep-19-2025
Risk Adjusted Returns v/s
Returns Beta

News
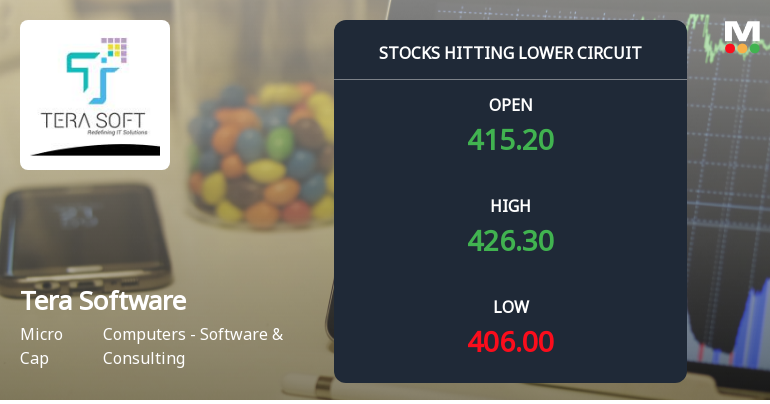
Tera Software Ltd Locks at Lower Circuit With 4.19% Loss — Sellers Queue, No Buyers in Sight
At Rs 403.55, sellers were still queuing — but there were no buyers willing to take the other side. Tera Software Ltd locked at its lower circuit of 4.19% on 23 Jun 2026, with unfilled sell orders and a frozen price that capped losses within the 5% price band.
Read full news article
Tera Software Ltd is Rated Hold
Tera Software Ltd is rated 'Hold' by MarketsMOJO, with this rating last updated on 08 June 2026. However, the analysis and financial metrics discussed here reflect the company’s current position as of 21 June 2026, providing investors with the latest insights into its performance and outlook.
Read full news article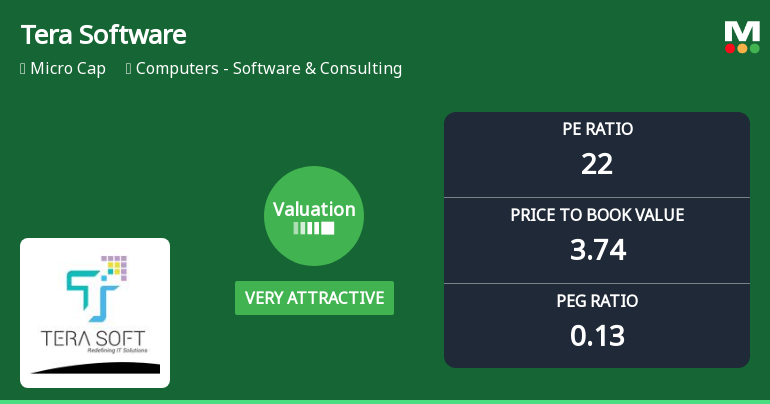
Tera Software Ltd Valuation Shifts Signal Renewed Price Attractiveness
Tera Software Ltd, a micro-cap player in the Computers - Software & Consulting sector, has seen a notable shift in its valuation parameters, moving from an attractive to a very attractive rating. This change reflects improved price metrics relative to historical averages and peer comparisons, signalling a potentially opportune moment for investors to reassess the stock’s appeal amid a mixed market backdrop.
Read full news article Announcements
Announcement under Regulation 30 (LODR)-Updates on Acquisition
13-Jun-2026 | Source : BSEWe wish to inform you that the Company has completed the acquisition of the remaining 2600 equity shares of TSIPL and accordingly TSIPL become a WOSC of Tera Software Limited w.e.f. June 13 2026.
Compliances-Reg.24(A)-Annual Secretarial Compliance
19-May-2026 | Source : BSEAnnual Secretarial Compliance Report for the year ended 31-03-2026.
Announcement under Regulation 30 (LODR)-Newspaper Publication
19-May-2026 | Source : BSEthe audited Financial Results of the company for the quarter and year ended 31-03-2026 have been published in the newspapers.
Corporate Actions

No Upcoming Board Meetings

Tera Software Ltd has declared 10% dividend, ex-date: 19 Sep 25

No Splits history available

Tera Software Ltd has announced 1:4 bonus issue, ex-date: 23 Nov 06

No Rights history available
Quality key factors
Valuation key factors
Technicals key factors
 Technical Indicator Scale: Bearish, Mildly Bearish, Sideways, Mildly Bullish, Bullish Turned
 Shareholding Snapshot : Mar 2026
Shareholding Compare (%holding)
Non Institution
19.8815
Held by 0 Schemes
Held by 1 FIIs (0.08%)
Raja Sekhar Tummala (22.58%)
Kollu Upendar Rao (4.4%)
44.35%
Quarterly Results Snapshot (Consolidated) - Mar'26 - QoQ

QoQ Growth in quarter ended Mar 2026 is 26.38% vs -17.21% in Dec 2025
QoQ Growth in quarter ended Mar 2026 is 13.34% vs -2.90% in Dec 2025
Half Yearly Results Snapshot (Consolidated) - Sep'25
Growth in half year ended Sep 2025 is 107.55% vs 23.59% in Sep 2024

Growth in half year ended Sep 2025 is 180.50% vs 555.74% in Sep 2024
Nine Monthly Results Snapshot (Consolidated) - Dec'25
YoY Growth in nine months ended Dec 2025 is 120.45% vs 20.77% in Dec 2024
YoY Growth in nine months ended Dec 2025 is 184.63% vs 259.30% in Dec 2024
Annual Results Snapshot (Consolidated) - Mar'26
YoY Growth in year ended Mar 2026 is 121.13% vs 27.43% in Mar 2025
YoY Growth in year ended Mar 2026 is 163.55% vs 140.66% in Mar 2025
About Tera Software Ltd

Company Coordinates


