Tera Software

  • Market Cap: Micro Cap
  • Industry: Computers - Software & Consulting
  • ISIN: INE482B01010
  • NSEID: TERASOFT
  • BSEID: 533982
INR
236.50
11.75 (5.23%)
BSENSE

Sep 18, 03:30 PM

BSE+NSE Vol: 28.98 k

  • Price Points
  • Score
  • Mojo Parameters
  • Total Return
  • News and Corporate Actions
  • Key factors
  • Shareholding
  • Financials
  • CompanyCV
stock-summaryPrice Point
High/Low

1Day

52 Week

Valuation
Technical
Day's Volume

CASH

28.98 k (-8.61%) Volume

Shareholding (Jun 2026)

FII

0.00%

Held by 2 FIIs

DII

0.00%

Held by 0 DIIs

Promoter

47.53%

Why is Tera Software Ltd falling/rising?

06-Sep-2026

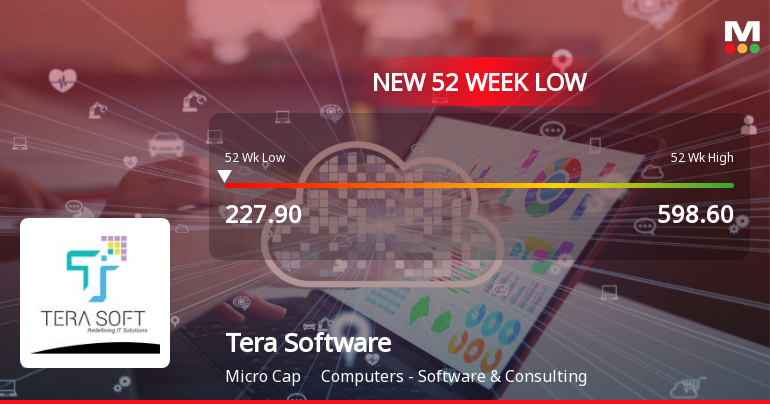
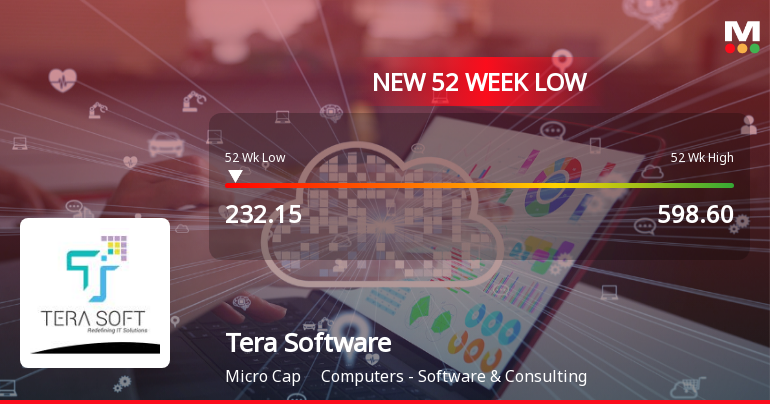
As of 05-Sep, Tera Software Ltd's stock price is 284.50, showing a slight increase of 0.46%. However, it has recently hit a 52-week low and is trading below all major moving averages, indicating a bearish trend and declining investor participation.

As of 05-Sep, Tera Software Ltd's stock price is currently at 284.50, reflecting a change of 1.3 (0.46%) increase. However, the stock has been experiencing a downward trend recently, having fallen -2.43% over the last two days and -30.44% over the past month. Today, the stock hit a new 52-week low of Rs.280, indicating significant selling pressure. <BR><BR>Additionally, Tera Software is trading below its 5-day, 20-day, 50-day, 100-day, and 200-day moving averages, which typically suggests a bearish trend. The delivery volume has also decreased significantly, with a drop of -43.81% compared to the 5-day average, indicating falling investor participation. <BR><BR>Despite the slight increase in price today, the overall performance metrics indicate that the stock is struggling, particularly in the short to medium term, as evidenced by its substantial declines over the past month and year.

View full answer

Who are in the management team of Tera Software?

01-Sep-2026

The management team of Tera Software includes T Gopi Chand (Chairman & Managing Director), T Bapaiah Choudary, T Pavana Devi (Directors), and several Independent Directors: T Hanuman Chowdary, T V Lakshmi, Divakar Atluri, and Braja Bandhu Nayak, along with CH Mallikarjuna as Company Secretary & Compliance Officer.

The management team of Tera Software includes the following members:<BR><BR>1. **T Gopi Chand** - Chairman & Managing Director<BR>2. **T Bapaiah Choudary** - Director<BR>3. **T Pavana Devi** - Director<BR>4. **T Hanuman Chowdary** - Independent Director<BR>5. **T V Lakshmi** - Independent Director<BR>6. **Divakar Atluri** - Independent Director<BR>7. **Braja Bandhu Nayak** - Independent Director<BR>8. **CH Mallikarjuna** - Company Secretary & Compliance Officer<BR><BR>This team brings a diverse range of expertise and leadership to the company.

View full answer

What does Tera Software do?

01-Sep-2026

Tera Software Ltd, based in Hyderabad, specializes in E Governance and enterprise information systems, with a market cap of INR 371 Cr. As of June 2026, it reported net sales of 50 Cr and a net profit of 5 Cr.

Overview: <BR>Tera Software Ltd is a Hyderabad-based company that provides services in E Governance and the development of enterprise information systems, operating within the Computers - Software & Consulting industry and classified as a Micro Cap.<BR><BR>History: <BR>Tera Software Ltd was founded in 1994 by Mr. Gopichand Tummala. As of the latest reporting period, the company has reported net sales and net profit for the quarter ending June 2026.<BR><BR>Financial Snapshot: <BR>Most recent Net Sales: 50 Cr (Quarterly Results - Jun 2026) <BR>Most recent Net Profit: 5 Cr (Quarterly Results - Jun 2026) <BR>Market-cap value: INR 371 Cr (Micro Cap)<BR><BR>Key Metrics: <BR>P/E: 15.00 <BR>Industry P/E: 22 <BR>Dividend Yield: 0.34% <BR>Debt-Equity: 0.23 <BR>Return on Equity: 16.99% <BR>Price to Book: 2.54<BR><BR>Contact Details: <BR>Address: 8-2-293/82/A/1107 PlotNo-1107, Road No-55 Jublilee Hills Hyderabad Telangana : 500033 <BR>Tel: 91-040-23547447 <BR>Email: info@terasoftware.com <BR>Website: http://www.terasoftware.com

View full answer

Who are the peers of the Tera Software?

01-Sep-2026

Tera Software's peers include XT Global Infotech, DigiSpice Technologies, Inspirisys Solutions, Sattrix Informatics, Trejhara Solutions, Covance Softsol, Pelatro, Virtual Galaxy, TechD Cybersec, and Systango Tech. Tera Software has average management risk, good growth, and a 1-year return of -5.66%, with Covance Softsol showing the highest return at 399.33%.

Peers: The peers of Tera Software are XT Global Infot., DigiSpice Tech., Inspirisys Sol., Sattrix Infor., Trejhara Solutio, Covance Softsol, Pelatro, Virtual Galaxy, TechD Cybersec, and Systango Tech.<BR><BR>Quality Snapshot: Excellent management risk is observed at Inspirisys Sol., Virtual Galaxy, and Systango Tech, while Average management risk is found at Tera Software, Covance Softsol, and TechD Cybersec. Below Average management risk is noted for XT Global Infot., DigiSpice Tech., Sattrix Infor., Trejhara Solutio. For growth, Excellent growth is seen at Sattrix Infor., Tera Software, Covance Softsol, Pelatro, Virtual Galaxy, TechD Cybersec, and Systango Tech, while Good growth is noted at Inspirisys Sol. Below Average growth is found at XT Global Infot., DigiSpice Tech., and Trejhara Solutio. In terms of Capital Structure, Excellent capital structure is observed at Sattrix Infor., Virtual Galaxy, and TechD Cybersec, while Good capital structure is found at Tera Software, XT Global Infot., DigiSpice Tech., Trejhara Solutio, Covance Softsol, and the rest.<BR><BR>Return Snapshot: Covance Softsol has the highest 1-year return at 399.33%, while DigiSpice Tech. has the lowest at -34.36%. Tera Software's 1-year return is -5.66%, which is higher than DigiSpice Tech. but significantly lower than Covance Softsol. Additionally, the six-month returns for XT Global Infot., DigiSpice Tech., Inspirisys Sol., Trejhara Solutio, and Covance Softsol are negative.

View full answer

How big is Tera Software?

01-Sep-2026

As of 31st August, Tera Software Ltd has a market capitalization of 371.00 Cr, with recent net sales of 255.18 Cr and a net profit of 24.80 Cr.

As of 31st August, Tera Software Ltd has a market capitalization of 371.00 Cr, categorizing it as a Micro Cap company.<BR><BR>In the latest four quarters, Tera Software reported Net Sales of 255.18 Cr and a Net Profit of 24.80 Cr.<BR><BR>The latest annual period for the balance sheet is March 2025, showing Shareholder's Funds of 122.44 Cr and Total Assets of 211.30 Cr.

View full answer

Should I buy, sell or hold Tera Software Ltd?

15-Aug-2026

Are Tera Software Ltd latest results good or bad?

19-May-2026

Tera Software Ltd's latest Q4 FY26 results are strong, with a 144.75% increase in net profit to ₹7.22 crores and a 122.71% rise in revenue to ₹74.74 crores. However, concerns about margin compression and rising interest expenses suggest potential challenges ahead.

Tera Software Ltd's latest results for Q4 FY26 indicate a strong performance overall, with significant year-on-year growth in both revenue and net profit. The company reported a net profit of ₹7.22 crores, marking a remarkable increase of 144.75% compared to the same quarter last year. Revenue also surged to ₹74.74 crores, reflecting a 122.71% year-on-year growth and a 26.38% increase from the previous quarter.<BR><BR>However, there are some concerns regarding margin compression. The operating margin decreased to 13.02%, down 358 basis points from the previous quarter, despite the revenue growth. This suggests potential challenges in maintaining pricing power or rising costs. Additionally, the company has experienced elevated interest expenses, which have increased significantly year-on-year.<BR><BR>While the results show exceptional growth, the sequential margin pressures and rising costs present a mixed picture. Investors should consider these factors when evaluating the overall health and future prospects of Tera Software.

View full answer

When is the next results date for Tera Software Ltd?

12-May-2026

The next results date for Tera Software Ltd is 18 May 2026.

The next results date for Tera Software Ltd is scheduled for 18 May 2026.

View full answer

Is Tera Software overvalued or undervalued?

03-Dec-2025

As of December 2, 2025, Tera Software is considered overvalued with a PE Ratio of 37.91 and an EV to EBITDA of 27.10, despite strong historical performance with a year-to-date return of 162.63%, compared to industry peers like TCS and Infosys, which have lower valuation ratios.

As of 2 December 2025, Tera Software's valuation grade has moved from very attractive to attractive, indicating a shift in market perception. The company is currently assessed as overvalued. Key ratios include a PE Ratio of 37.91, an EV to EBITDA of 27.10, and a PEG Ratio of 0.29, which suggests that while growth potential is present, the current price may not justify the earnings growth relative to peers.<BR><BR>In comparison to its industry peers, TCS has a PE Ratio of 22.56 and an EV to EBITDA of 15.86, while Infosys shows a PE Ratio of 23.06 and an EV to EBITDA of 15.14, both indicating that Tera Software's valuation is significantly higher. Additionally, Tera Software's recent stock performance has outpaced the Sensex, with a year-to-date return of 162.63% compared to the Sensex's 8.96%, highlighting strong historical performance despite current overvaluation concerns.

View full answer

How has been the historical performance of Tera Software?

13-Nov-2025

Tera Software's historical performance has been mixed, with net sales increasing to 107.65 Cr in March 2025 from 84.48 Cr in March 2024, but down from 130.80 Cr in March 2023. Profitability metrics improved significantly, with profit after tax rising to 9.41 Cr in March 2025, despite fluctuations in sales and cash flow.

Answer:<BR>The historical performance of Tera Software shows a mixed trend over the past three fiscal years.<BR><BR>Breakdown:<BR>In the fiscal year ending March 2025, Tera Software reported net sales of 107.65 Cr, an increase from 84.48 Cr in March 2024, but a decline from 130.80 Cr in March 2023. The total operating income mirrored this trend, reaching 107.65 Cr in March 2025, up from 84.48 Cr in the previous year, yet down from 130.80 Cr two years prior. The company's operating profit (PBDIT) improved to 16.35 Cr in March 2025 from 10.53 Cr in March 2024, while profit before tax also rose to 12.37 Cr from 6.13 Cr. Consequently, profit after tax increased significantly to 9.41 Cr in March 2025, compared to 3.91 Cr in March 2024 and 3.47 Cr in March 2023. The earnings per share (EPS) surged to 7.52 in March 2025 from 3.13 in March 2024. On the balance sheet, total liabilities increased slightly to 211.30 Cr in March 2025 from 205.21 Cr in March 2024, while total assets also rose to 211.30 Cr. Cash flow from operating activities improved to 6.00 Cr in March 2025 from -2.00 Cr in March 2024, although the net cash outflow was -9.00 Cr in March 2025, down from a net inflow of 4.00 Cr in March 2024. Overall, Tera Software has shown improvements in profitability metrics, despite fluctuations in sales and cash flow.

View full answer

How has been the historical performance of Tera Software?

12-Nov-2025

Tera Software's historical performance shows mixed results, with net sales increasing to 107.65 Cr in March 2025 but declining from 130.80 Cr in March 2023. Profitability metrics improved, with profit after tax rising to 9.41 Cr and EPS increasing to 7.52, despite challenges in sales and cash flow management.

Answer:<BR>The historical performance of Tera Software shows fluctuations in key financial metrics over the past three years.<BR><BR>Breakdown:<BR>In the fiscal year ending March 2025, Tera Software reported net sales of 107.65 Cr, an increase from 84.48 Cr in March 2024 but a decline from 130.80 Cr in March 2023. Total operating income mirrored this trend, reaching 107.65 Cr in March 2025. The company experienced a total expenditure of 95.36 Cr in March 2025, up from 77.88 Cr in March 2024 but down from 140.71 Cr in March 2023. Operating profit (PBDIT) improved to 16.35 Cr in March 2025, compared to 10.53 Cr in March 2024 and 15.25 Cr in March 2023. Profit before tax also rose to 12.37 Cr in March 2025 from 6.13 Cr in March 2024, while profit after tax increased to 9.41 Cr from 3.91 Cr in the previous year. The earnings per share (EPS) significantly improved to 7.52 in March 2025, up from 3.13 in March 2024 and 2.77 in March 2023. On the balance sheet, total liabilities increased to 211.30 Cr in March 2025 from 205.21 Cr in March 2024, with total assets also rising to 211.30 Cr. The cash flow from operating activities turned positive at 6.00 Cr in March 2025, compared to a negative 2.00 Cr in March 2024, although the net cash outflow was 9.00 Cr in March 2025. Overall, Tera Software's financial performance reflects a mixed trend with improvements in profitability metrics but challenges in sales and cash flow management.

View full answer

Who are the top shareholders of the Tera Software?

17-Jul-2025

The top shareholder of Tera Software is Raja Sekhar Tummala, holding 22.58%, followed by individual investors with a collective 43.86%. The highest public shareholder is Kollu Upendar Rao at 4.16%, with no mutual funds or foreign institutional investors involved.

The top shareholders of Tera Software include Raja Sekhar Tummala, who is the promoter with the highest holding at 22.58%. The majority of the shareholding is held by non-institutional investors, with individual investors collectively holding 43.86%. The highest public shareholder is Kollu Upendar Rao, who holds 4.16%. Additionally, there are no mutual funds or foreign institutional investors currently holding shares in the company.

View full answer

What is the technical trend for Tera Software?

09-Jun-2025

As of June 5, 2025, Tera Software's technical trend is bullish, supported by positive MACD and Bollinger Bands indicators, despite some divergence in volume and a mildly bearish weekly KST.

As of 5 June 2025, the technical trend for Tera Software has changed from mildly bullish to bullish. The weekly and monthly MACD indicators are both bullish, supporting a positive outlook. Additionally, Bollinger Bands are bullish on both time frames, indicating strong price momentum. The daily moving averages also reflect a bullish stance. However, the weekly KST is bullish while the OBV shows a mildly bearish trend, suggesting some divergence in volume support. The Dow Theory indicates a mildly bearish stance on the weekly chart, but there is no trend on the monthly. Overall, the current technical stance is bullish, with strong momentum indicators driving this outlook.

View full answer

What is the bonus history of the Tera Software?

06-Jun-2025

Tera Software announced a 1:4 bonus issue on November 23, 2006, with a record date of November 25, 2006, granting shareholders one additional share for every four shares held.

Tera Software has a bonus history that includes a 1:4 bonus issue announced on November 23, 2006. The record date for this bonus was November 25, 2006. This means that for every four shares held, shareholders received one additional share as a bonus.

View full answer

Has Tera Software declared dividend?

06-Jun-2025

Tera Software Ltd has declared a 12% dividend, amounting to 1.2 per share, with an ex-date of September 22, 2016. However, the dividend yield is currently 0%, as the company has shown substantial price returns over the years without ongoing dividend returns.

Tera Software Ltd has declared a 12% dividend.<BR><BR>Dividend Details:<BR>- Percentage announced: 12%<BR>- Amount per share: 1.2<BR>- Ex-date: 22 Sep 16<BR><BR>Dividend Yield: 0%<BR><BR>Total Returns by Period:<BR>Over the 6-month period, the price return was 45.52%, with no dividend return, resulting in a total return of 45.52%.<BR><BR>In the 1-year period, the price return was 287.97%, with no dividend return, leading to a total return of 287.97%.<BR><BR>For the 2-year period, the price return was 502.68%, with no dividend return, culminating in a total return of 502.68%.<BR><BR>During the 3-year period, the price return was 562.5%, with no dividend return, resulting in a total return of 562.5%.<BR><BR>In the 4-year period, the price return was 485.06%, with no dividend return, leading to a total return of 485.06%.<BR><BR>Over the 5-year period, the price return was 1221.76%, with no dividend return, culminating in a total return of 1221.76%.<BR><BR>Overall, Tera Software Ltd has declared a dividend, but the dividend yield is currently 0%. The company has shown significant price returns over the years, indicating strong performance despite the lack of ongoing dividend returns.

View full answer
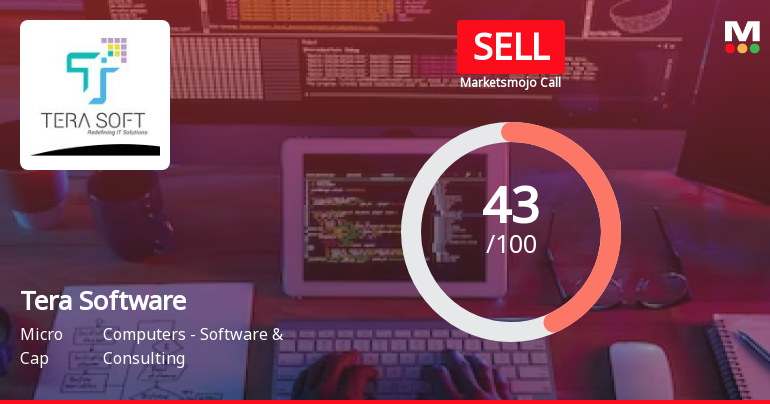
iScoreScore
Click here to find our call on this stock
Strong Sell
Sell
Hold
Buy
Strong Buy

Dashboard

1

Underperformed the market in the last 1 year

  • Even though the market (BSE500) generated negative returns of -3.53% in the last 1 year, its fall in the stock was much higher with a return of -44.31%
stock-summaryMojo Parameters

Mojo Parameters

Loading Valuation Snapshot...

Stock DNA

stock-summary
Industry

Computers - Software & Consulting

stock-summary
Market cap

INR 297 Cr (Micro Cap)

stock-summary
P/E

12.00

stock-summary
Industry P/E

20

stock-summary
Dividend Yield

0.45%

stock-summary
Debt Equity

0.23

stock-summary
Return on Equity

16.99%

stock-summary
Price to Book

1.92

Revenue and Profits:
Net Sales:
50 Cr
(Quarterly Results - Jun 2026)
Net Profit:
5 Cr
stock-summaryTotal Returns
Total Returns (Price + Dividend) stock-summary
Dividend Yield (0.45%)
TimePeriod
Price Return
Dividend Return
Total Return
3 Months
-43.45%
0.28%
-43.17%
6 Months
-30.02%
0.38%
-29.64%
1 Year
-44.31%
0.27%
-44.04%
2 Years
213.49%
2.46%
215.95%
3 Years
463.1%
4.99%
468.09%
4 Years
388.13%
4.74%
392.87%
5 Years
368.78%
3.86%
372.64%

Latest dividend: 1 per share ex-dividend date: Sep-19-2025

Risk Adjusted Returns v/s stock-summary
Returns Beta
Icon
Beta has not been calculated since enough price history is not available
stock-summaryNews & Corporate Actions

Announcements stock-summary

Announcement under Regulation 30 (LODR)-Change in Management

16-Sep-2026 | Source : BSE

Resignation of CFO

Notice Of AGM To Be Held On 26-09-2026 Alongwith Annual Report

07-Sep-2026 | Source : BSE

We hereby submit the Notice of the 32nd AGM of the Members of the company to be held on Tuesday September 29 2026. Find attached Annual Report of 2025-26.

Paper Publication In Connection With AGM

07-Sep-2026 | Source : BSE

paper publication in connection with AGM

Corporate Actions stock-summary

stock-summary
BOARD MEETING

No Upcoming Board Meetings

stock-summary
DIVIDEND

Tera Software Ltd has declared 12% dividend, ex-date: 22 Sep 26

stock-summary
SPLITS

No Splits history available

stock-summary
BONUS

Tera Software Ltd has announced 1:4 bonus issue, ex-date: 23 Nov 06

stock-summary
RIGHTS

No Rights history available

stock-summaryKey Factors

Quality key factors stock-summary

Factor
Value
Sales Growth (5y)
68.49%
EBIT Growth (5y)
106.80%
EBIT to Interest (avg)
3.59
Debt to EBITDA (avg)
3.30
Net Debt to Equity (avg)
0.23
Sales to Capital Employed (avg)
0.76
Tax Ratio
22.75%
Dividend Payout Ratio
0
Pledged Shares
18.20%
Institutional Holding
0.00%
ROCE (avg)
9.82%
ROE (avg)
12.24%

Valuation key factors

Factor
Value
P/E Ratio
12
Industry P/E
20
Price to Book Value
2.03
EV to EBIT
9.28
EV to EBITDA
9.07
EV to Capital Employed
1.83
EV to Sales
1.29
PEG Ratio
0.10
Dividend Yield
0.42%
ROCE (Latest)
19.99%
ROE (Latest)
16.99%

Technicals key factors

Indicator
Weekly
Monthly
MACD
Bearish
Mildly Bearish
RSI
No Signal
No Signal
Bollinger Bands
Bearish
Bearish
Moving Averages
Bearish (Daily)
KST
Bearish
Mildly Bearish
Dow Theory
Mildly Bearish
Mildly Bearish
OBV
Mildly Bearish
Mildly Bearish
stock-summary Technical Indicator Scale: Bearish, Mildly Bearish, Sideways, Mildly Bullish, Bullish  Turned 
stock-summaryShareholding
Shareholding Snapshot : Jun 2026stock-summary
Shareholding Compare (%holding) stock-summary
Majority shareholders

Non Institution

Pledged Promoter Holdings

18.2001

Mutual Funds

Held by 0 Schemes

FIIs

Held by 2 FIIs (0.0%)

Promoter with highest holding

Raja Sekhar Tummala (22.58%)

Highest Public shareholder

Kollu Upendar Rao (4.4%)

Individual Investors Holdings

44.35%

stock-summaryFinancial
[
  {
    "link": "quarterly",
    "btn_text": "All Quarterly Results",
    "header": "Quarterly Results Snapshot (Consolidated) - Jun'26 - QoQ",
    "rhs": [
      {
        "prefix": "Net Sales ",
        "suffix": "QoQ Growth in quarter ended Jun 2026 is -33.28% vs 26.38% in Mar 2026",
        "dir": -1
      },
      {
        "prefix": "Consolidated Net Profit ",
        "suffix": "QoQ Growth in quarter ended Jun 2026 is -35.60% vs 13.34% in Mar 2026",
        "dir": -1
      }
    ],
    "table": {
      "header": [
        "Jun'26",
        "Mar'26",
        "Change(%)"
      ],
      "body": [
        {
          "field": "Net Sales",
          "val1": "49.87",
          "val2": "74.74",
          "chgp": "-33.28%",
          "chgp_class": "negative"
        },
        {
          "field": "Operating Profit (PBDIT) excl Other Income",
          "val1": "7.15",
          "val2": "9.73",
          "chgp": "-26.52%",
          "chgp_class": "negative"
        },
        {
          "field": "Interest",
          "val1": "2.17",
          "val2": "1.91",
          "chgp": "13.61%",
          "chgp_class": "negative"
        },
        {
          "field": "Exceptional Items",
          "val1": "0.00",
          "val2": "0.00",
          "chgp": "",
          "chgp_class": "neutral"
        },
        {
          "field": "Consolidate Net Profit",
          "val1": "4.65",
          "val2": "7.22",
          "chgp": "-35.60%",
          "chgp_class": "negative"
        },
        {
          "field": "Operating Profit Margin (Excl OI)",
          "val1": "14.34%",
          "val2": "13.02%",
          "chgp": "1.32%",
          "chgp_class": "positive"
        }
      ]
    }
  },
  {
    "link": "half-yearly",
    "btn_text": "All Half Yearly Results",
    "header": "Half Yearly Results Snapshot (Consolidated) - Sep'25",
    "rhs": [
      {
        "prefix": "Net Sales ",
        "suffix": " Growth in half year ended Sep 2025 is 107.55% vs 23.59% in Sep 2024",
        "dir": 1
      },
      {
        "prefix": "Consolidated Net Profit ",
        "suffix": " Growth in half year ended Sep 2025 is 180.50% vs 555.74% in Sep 2024",
        "dir": -1
      }
    ],
    "table": {
      "header": [
        "Sep'25",
        "Sep'24",
        "Change(%)"
      ],
      "body": [
        {
          "field": "Net Sales",
          "val1": "104.17",
          "val2": "50.19",
          "chgp": "107.55%",
          "chgp_class": "positive"
        },
        {
          "field": "Operating Profit (PBDIT) excl Other Income",
          "val1": "17.17",
          "val2": "5.75",
          "chgp": "198.61%",
          "chgp_class": "positive"
        },
        {
          "field": "Interest",
          "val1": "3.60",
          "val2": "1.78",
          "chgp": "102.25%",
          "chgp_class": "negative"
        },
        {
          "field": "Exceptional Items",
          "val1": "0.00",
          "val2": "-0.04",
          "chgp": "100.00%",
          "chgp_class": "positive"
        },
        {
          "field": "Consolidate Net Profit",
          "val1": "11.22",
          "val2": "4.00",
          "chgp": "180.50%",
          "chgp_class": "positive"
        },
        {
          "field": "Operating Profit Margin (Excl OI)",
          "val1": "16.48%",
          "val2": "11.55%",
          "chgp": "4.93%",
          "chgp_class": "positive"
        }
      ]
    }
  },
  {
    "link": "nine-monthly",
    "btn_text": "All Nine Monthly Results",
    "header": "Nine Monthly Results Snapshot (Consolidated) - Dec'25",
    "rhs": [
      {
        "prefix": "Net Sales ",
        "suffix": "YoY Growth in nine months ended Dec 2025 is 120.45% vs 20.77% in Dec 2024",
        "dir": 1
      },
      {
        "prefix": "Consolidated Net Profit ",
        "suffix": "YoY Growth in nine months ended Dec 2025 is 184.63% vs 259.30% in Dec 2024",
        "dir": -1
      }
    ],
    "table": {
      "header": [
        "Dec'25",
        "Dec'24",
        "Change(%)"
      ],
      "body": [
        {
          "field": "Net Sales",
          "val1": "163.31",
          "val2": "74.08",
          "chgp": "120.45%",
          "chgp_class": "positive"
        },
        {
          "field": "Operating Profit (PBDIT) excl Other Income",
          "val1": "26.99",
          "val2": "8.64",
          "chgp": "212.38%",
          "chgp_class": "positive"
        },
        {
          "field": "Interest",
          "val1": "5.53",
          "val2": "2.90",
          "chgp": "90.69%",
          "chgp_class": "negative"
        },
        {
          "field": "Exceptional Items",
          "val1": "0.00",
          "val2": "-0.04",
          "chgp": "100.00%",
          "chgp_class": "positive"
        },
        {
          "field": "Consolidate Net Profit",
          "val1": "17.59",
          "val2": "6.18",
          "chgp": "184.63%",
          "chgp_class": "positive"
        },
        {
          "field": "Operating Profit Margin (Excl OI)",
          "val1": "16.53%",
          "val2": "11.66%",
          "chgp": "4.87%",
          "chgp_class": "positive"
        }
      ]
    }
  },
  {
    "link": "annual",
    "btn_text": "All Annual Results",
    "header": "Annual Results Snapshot (Consolidated) - Mar'26",
    "rhs": [
      {
        "prefix": "Net Sales ",
        "suffix": "YoY Growth in year ended Mar 2026 is 121.13% vs 27.43% in Mar 2025",
        "dir": 1
      },
      {
        "prefix": "Consolidated Net Profit ",
        "suffix": "YoY Growth in year ended Mar 2026 is 163.55% vs 140.66% in Mar 2025",
        "dir": 1
      }
    ],
    "table": {
      "header": [
        "Mar'26",
        "Mar'25",
        "Change(%)"
      ],
      "body": [
        {
          "field": "Net Sales",
          "val1": "238.05",
          "val2": "107.65",
          "chgp": "121.13%",
          "chgp_class": "positive"
        },
        {
          "field": "Operating Profit (PBDIT) excl Other Income",
          "val1": "36.71",
          "val2": "12.29",
          "chgp": "198.70%",
          "chgp_class": "positive"
        },
        {
          "field": "Interest",
          "val1": "7.45",
          "val2": "3.79",
          "chgp": "96.57%",
          "chgp_class": "negative"
        },
        {
          "field": "Exceptional Items",
          "val1": "0.00",
          "val2": "-0.04",
          "chgp": "100.00%",
          "chgp_class": "positive"
        },
        {
          "field": "Consolidate Net Profit",
          "val1": "24.80",
          "val2": "9.41",
          "chgp": "163.55%",
          "chgp_class": "positive"
        },
        {
          "field": "Operating Profit Margin (Excl OI)",
          "val1": "15.42%",
          "val2": "11.46%",
          "chgp": "3.96%",
          "chgp_class": "positive"
        }
      ]
    }
  }
]

Quarterly Results Snapshot (Consolidated) - Jun'26 - QoQstock-summary

Jun'26
Mar'26
Change(%)
Net Sales
49.87
74.74
-33.28%
Operating Profit (PBDIT) excl Other Income
7.15
9.73
-26.52%
Interest
2.17
1.91
13.61%
Exceptional Items
0.00
0.00
Consolidate Net Profit
4.65
7.22
-35.60%
Operating Profit Margin (Excl OI)
14.34%
13.02%
1.32%
Values in Rs Cr.
Direction Arrows
Net Sales

QoQ Growth in quarter ended Jun 2026 is -33.28% vs 26.38% in Mar 2026

Direction Arrows
Consolidated Net Profit

QoQ Growth in quarter ended Jun 2026 is -35.60% vs 13.34% in Mar 2026

Half Yearly Results Snapshot (Consolidated) - Sep'25stock-summary

Sep'25
Sep'24
Change(%)
Net Sales
104.17
50.19
107.55%
Operating Profit (PBDIT) excl Other Income
17.17
5.75
198.61%
Interest
3.60
1.78
102.25%
Exceptional Items
0.00
-0.04
100.00%
Consolidate Net Profit
11.22
4.00
180.50%
Operating Profit Margin (Excl OI)
16.48%
11.55%
4.93%
Values in Rs Cr.
Direction Arrows
Net Sales

Growth in half year ended Sep 2025 is 107.55% vs 23.59% in Sep 2024

Direction Arrows
Consolidated Net Profit

Growth in half year ended Sep 2025 is 180.50% vs 555.74% in Sep 2024

Nine Monthly Results Snapshot (Consolidated) - Dec'25stock-summary

Dec'25
Dec'24
Change(%)
Net Sales
163.31
74.08
120.45%
Operating Profit (PBDIT) excl Other Income
26.99
8.64
212.38%
Interest
5.53
2.90
90.69%
Exceptional Items
0.00
-0.04
100.00%
Consolidate Net Profit
17.59
6.18
184.63%
Operating Profit Margin (Excl OI)
16.53%
11.66%
4.87%
Values in Rs Cr.
Direction Arrows
Net Sales

YoY Growth in nine months ended Dec 2025 is 120.45% vs 20.77% in Dec 2024

Direction Arrows
Consolidated Net Profit

YoY Growth in nine months ended Dec 2025 is 184.63% vs 259.30% in Dec 2024

Annual Results Snapshot (Consolidated) - Mar'26stock-summary

Mar'26
Mar'25
Change(%)
Net Sales
238.05
107.65
121.13%
Operating Profit (PBDIT) excl Other Income
36.71
12.29
198.70%
Interest
7.45
3.79
96.57%
Exceptional Items
0.00
-0.04
100.00%
Consolidate Net Profit
24.80
9.41
163.55%
Operating Profit Margin (Excl OI)
15.42%
11.46%
3.96%
Values in Rs Cr.
Direction Arrows
Net Sales

YoY Growth in year ended Mar 2026 is 121.13% vs 27.43% in Mar 2025

Direction Arrows
Consolidated Net Profit

YoY Growth in year ended Mar 2026 is 163.55% vs 140.66% in Mar 2025

stock-summaryCompany CV
About Tera Software Ltd stock-summary
stock-summary
Tera Software Ltd
Micro Cap
Computers - Software & Consulting
Tera Software Limited (TSL), founded in year 1994 by Mr. Gopichand Tummala and holds 47.53% shareholding together with his family members as on 31st March, 2025. Tera Software Limited is a Hyderabad based company providing services in E Governance and development of enterprise information systems for Sales Tax/GST, Public Distribution System, Registration, Education, Road Transports, Electricity Billing, UIDAI (AADHAAR) & NPR (National Population Register).
Company Coordinates stock-summary
Company Details
8-2-293/82/A/1107 PlotNo-1107, Road No-55 Jublilee Hills Hyderabad Telangana : 500033
stock-summary
Tel: 91-040-23547447
stock-summary
info@terasoftware.com
Registrar Details
Karvy Computershare Pvt Ltd., Karvy Selenium, Tower-B Plot No 31 & 32, Survey No 116/22, 115/24, 115/25, Financial District, Nanakramguda, Serilingampally, Mandal Ranga Reddy Dist, Hyderabad