
Compare Panchmahal Steel with Similar Stocks
Dashboard
Poor long term growth as Operating profit has grown by an annual rate -27.34% of over the last 5 years
Flat results in Mar 26
With ROCE of 1.7, it has a Expensive valuation with a 3 Enterprise value to Capital Employed
Despite the size of the company, domestic mutual funds hold only 0% of the company
Stock DNA
Iron & Steel Products
INR 561 Cr (Micro Cap)
NA (Loss Making)
26
1.10%
0.23
-1.50%
3.46
Total Returns (Price + Dividend) 
Latest dividend: 3 per share ex-dividend date: Sep-12-2025
Risk Adjusted Returns v/s
Returns Beta

News

Panchmahal Steel Ltd Faces Bearish Momentum Amid Technical Downgrade
Panchmahal Steel Ltd, a micro-cap player in the Iron & Steel Products sector, has experienced a notable shift in its technical momentum, with indicators signalling a bearish trend. The stock’s recent price action and technical parameters suggest increased selling pressure, raising concerns for investors amid a challenging market backdrop.
Read full news article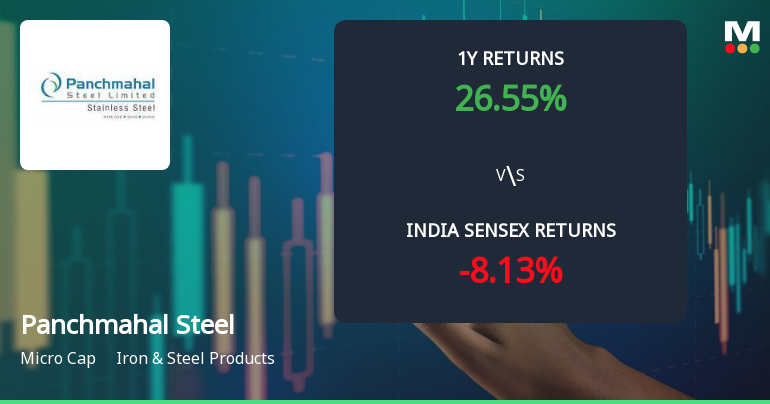
Panchmahal Steel Ltd Faces Mildly Bearish Momentum Amid Technical Downgrade
Panchmahal Steel Ltd has experienced a notable shift in its technical momentum, transitioning from a sideways trend to a mildly bearish stance. Recent technical indicators, including MACD, RSI, and moving averages, signal increased selling pressure, reflecting a cautious outlook for this micro-cap iron and steel products company amid broader market dynamics.
Read full news article
Panchmahal Steel Ltd Downgraded to Sell Amid Technical and Financial Concerns
Panchmahal Steel Ltd, a micro-cap player in the Iron & Steel Products sector, has seen its investment rating downgraded from Hold to Sell as of 6 July 2026. This change reflects a combination of deteriorating technical indicators, flat financial performance, and valuation concerns, despite the stock’s recent market-beating returns. The downgrade highlights growing caution among analysts regarding the company’s long-term growth prospects and technical momentum.
Read full news article Announcements
Intimation Under Reg. 30 Of SEBI (LODR)
14-Jul-2026 | Source : BSEDisclosure of material event
Board Meeting Intimation for Consideration And Approval Of Unaudited Financial Results Of The Company For The Quarter Period Ended 30.06.2026.
10-Jul-2026 | Source : BSEPanchmahal Steel Ltdhas informed BSE that the meeting of the Board of Directors of the Company is scheduled on 03/08/2026 inter alia to consider and approve Unaudited Financial Results of the Company for the quarter period ended 30.06.2026
Compliances-Certificate under Reg. 74 (5) of SEBI (DP) Regulations 2018
04-Jul-2026 | Source : BSECertificate under Reg. 74(5) of SEBI (DP) Regulations 2018 for the quarter period ended 30.06.2026
Corporate Actions

03 Aug 2026

Panchmahal Steel Ltd has declared 30% dividend, ex-date: 12 Sep 25

No Splits history available

No Bonus history available

No Rights history available
Quality key factors
Valuation key factors
Technicals key factors
 Technical Indicator Scale: Bearish, Mildly Bearish, Sideways, Mildly Bullish, Bullish Turned
 Shareholding Snapshot : Jun 2026
Shareholding Compare (%holding)
Promoters
5.7892
Held by 0 Schemes
Held by 0 FIIs
Honeyvick Enterprises Private Limited (55.36%)
Dimple Kamlesh Kanungo (8.81%)
16.49%
Quarterly Results Snapshot (Standalone) - Mar'26 - QoQ

QoQ Growth in quarter ended Mar 2026 is 8.00% vs 5.92% in Dec 2025

QoQ Growth in quarter ended Mar 2026 is -272.36% vs 123.64% in Dec 2025
Half Yearly Results Snapshot (Standalone) - Sep'25
Growth in half year ended Sep 2025 is -8.62% vs -12.97% in Sep 2024
Growth in half year ended Sep 2025 is -137.13% vs 334.12% in Sep 2024
Nine Monthly Results Snapshot (Standalone) - Dec'25
YoY Growth in nine months ended Dec 2025 is -4.66% vs -11.31% in Dec 2024
YoY Growth in nine months ended Dec 2025 is -102.62% vs 909.43% in Dec 2024
Annual Results Snapshot (Standalone) - Mar'26
YoY Growth in year ended Mar 2026 is 0.30% vs -10.41% in Mar 2025
YoY Growth in year ended Mar 2026 is -167.87% vs 12.12% in Mar 2025
About Panchmahal Steel Ltd

Company Coordinates


