
Compare Panchmahal Steel with Similar Stocks
Dashboard
Poor long term growth as Operating profit has grown by an annual rate -27.34% of over the last 5 years
Flat results in Mar 26
With ROCE of 1.7, it has a Expensive valuation with a 3.1 Enterprise value to Capital Employed
Despite the size of the company, domestic mutual funds hold only 0% of the company
Stock DNA
Iron & Steel Products
INR 554 Cr (Micro Cap)
NA (Loss Making)
26
1.03%
0.23
-1.50%
3.67
Total Returns (Price + Dividend) 
Latest dividend: 3 per share ex-dividend date: Sep-12-2025
Risk Adjusted Returns v/s
Returns Beta

News

Panchmahal Steel Ltd is Rated Sell
Panchmahal Steel Ltd is rated 'Sell' by MarketsMOJO, with this rating last updated on 06 July 2026. However, the analysis and financial metrics discussed here reflect the stock's current position as of 18 July 2026, providing investors with the most recent insights into the company’s performance and outlook.
Read full news article
Panchmahal Steel Ltd Faces Bearish Momentum Amid Technical Downgrade
Panchmahal Steel Ltd, a micro-cap player in the Iron & Steel Products sector, has experienced a notable shift in its technical momentum, with indicators signalling a bearish trend. The stock’s recent price action and technical parameters suggest increased selling pressure, raising concerns for investors amid a challenging market backdrop.
Read full news article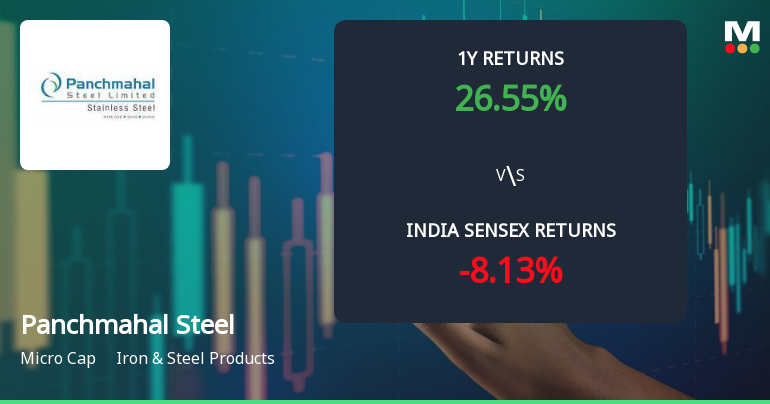
Panchmahal Steel Ltd Faces Mildly Bearish Momentum Amid Technical Downgrade
Panchmahal Steel Ltd has experienced a notable shift in its technical momentum, transitioning from a sideways trend to a mildly bearish stance. Recent technical indicators, including MACD, RSI, and moving averages, signal increased selling pressure, reflecting a cautious outlook for this micro-cap iron and steel products company amid broader market dynamics.
Read full news article Announcements
Intimation Under Reg. 30 Of SEBI (LODR)
14-Jul-2026 | Source : BSEDisclosure of material event
Board Meeting Intimation for Consideration And Approval Of Unaudited Financial Results Of The Company For The Quarter Period Ended 30.06.2026.
10-Jul-2026 | Source : BSEPanchmahal Steel Ltdhas informed BSE that the meeting of the Board of Directors of the Company is scheduled on 03/08/2026 inter alia to consider and approve Unaudited Financial Results of the Company for the quarter period ended 30.06.2026
Compliances-Certificate under Reg. 74 (5) of SEBI (DP) Regulations 2018
04-Jul-2026 | Source : BSECertificate under Reg. 74(5) of SEBI (DP) Regulations 2018 for the quarter period ended 30.06.2026
Corporate Actions

03 Aug 2026

Panchmahal Steel Ltd has declared 30% dividend, ex-date: 12 Sep 25

No Splits history available

No Bonus history available

No Rights history available
Quality key factors
Valuation key factors
Technicals key factors
 Technical Indicator Scale: Bearish, Mildly Bearish, Sideways, Mildly Bullish, Bullish Turned
 Shareholding Snapshot : Jun 2026
Shareholding Compare (%holding)
Promoters
5.7892
Held by 0 Schemes
Held by 0 FIIs
Honeyvick Enterprises Private Limited (55.36%)
Dimple Kamlesh Kanungo (8.81%)
16.49%
Quarterly Results Snapshot (Standalone) - Mar'26 - QoQ

QoQ Growth in quarter ended Mar 2026 is 8.00% vs 5.92% in Dec 2025

QoQ Growth in quarter ended Mar 2026 is -272.36% vs 123.64% in Dec 2025
Half Yearly Results Snapshot (Standalone) - Sep'25
Growth in half year ended Sep 2025 is -8.62% vs -12.97% in Sep 2024
Growth in half year ended Sep 2025 is -137.13% vs 334.12% in Sep 2024
Nine Monthly Results Snapshot (Standalone) - Dec'25
YoY Growth in nine months ended Dec 2025 is -4.66% vs -11.31% in Dec 2024
YoY Growth in nine months ended Dec 2025 is -102.62% vs 909.43% in Dec 2024
Annual Results Snapshot (Standalone) - Mar'26
YoY Growth in year ended Mar 2026 is 0.30% vs -10.41% in Mar 2025
YoY Growth in year ended Mar 2026 is -167.87% vs 12.12% in Mar 2025
About Panchmahal Steel Ltd

Company Coordinates


