BASF India

  • Market Cap: Small Cap
  • Industry: Specialty Chemicals
  • ISIN: INE373A01013
  • NSEID: BASF
  • BSEID: 500042
INR
4,004.95
-78.9 (-1.93%)
BSENSE

Aug 17, 02:09 PM

BSE+NSE Vol: 55.67 k

  • Price Points
  • Score
  • Mojo Parameters
  • Total Return
  • News and Corporate Actions
  • Key factors
  • Shareholding
  • Financials
  • CompanyCV
stock-summaryPrice Point
High/Low

1Day

52 Week

Valuation
Technical
Day's Volume

CASH

55.67 k (126.72%) Volume

Shareholding (Jun 2026)

FII

5.21%

Held by 113 FIIs

DII

6.29%

Held by 9 DIIs

Promoter

73.33%

Why is BASF India Ltd falling/rising?

16-Aug-2026

As of 16-Aug, BASF India Ltd's stock price is currently at 4,065.00, down 1.64%, but it remains above key moving averages, indicating long-term resilience. Despite a recent decline, strong financial performance and a favorable PEG ratio suggest potential for future growth.

As of 16-Aug, BASF India Ltd's stock price is falling, currently at 4,065.00, reflecting a change of -67.95 (-1.64%). This decline can be attributed to its performance today, where it underperformed the sector by -0.99%. Despite this short-term drop, the stock has shown resilience in the longer term, trading above its 5-day, 20-day, 50-day, 100-day, and 200-day moving averages, indicating a generally upward trend over a more extended period.<BR><BR>In the past month, the stock has increased by 12.38%, contrasting with a slight decline of 0.58% over the past week. Year-to-date, it has gained 3.16%, while the Sensex has decreased by 8.46%. However, over the last year, the stock has experienced a decline of 10.22%, which is significantly worse than the Sensex's drop of 3.21%. <BR><BR>The company's strong financial performance, including a net profit growth of 162.22% and positive results over the last two quarters, suggests underlying strength. Additionally, being net-debt free and having high cash and cash equivalents of Rs 873.60 cr supports its financial stability. Despite the recent price drop, the stock is trading at a discount compared to its peers, with a PEG ratio of 0.6, indicating potential for future growth. <BR><BR>Overall, while the stock is currently falling, its long-term performance and strong fundamentals may provide a basis for recovery in the future.

View full answer

Who are in the management team of BASF India?

14-Aug-2026

The management team of BASF India includes key members such as Pradip P Shah (Chairman), Alexander Gerding (Managing Director), and Narendranath J Baliga (CFO), along with several independent directors and other executives, all contributing to the company's strategic direction and operations.

The management team of BASF India includes the following key members:<BR><BR>1. **Pradip P Shah** - Chairman & Independent Director<BR>2. **R A Shah** - Independent Director<BR>3. **Arun Bewoor** - Independent Director<BR>4. **Narendranath J Baliga** - Alternate Director & CFO<BR>5. **Ramkumar Dhruva** - Director<BR>6. **Shyamala Gopinath** - Independent Director<BR>7. **Carola Richter** - Director<BR>8. **Manohar Kamath** - Company Secretary & Compliance Officer<BR>9. **Anil Kumar Choudhary** - Whole-time Director<BR>10. **Alexander Gerding** - Managing Director<BR><BR>This team brings a diverse range of expertise to the company, contributing to its strategic direction and operational management.

View full answer

What does BASF India do?

14-Aug-2026

BASF India Ltd is a leading small-cap specialty chemicals company, with net sales of ₹4,824 Cr and a net profit of ₹360 Cr as of June 2026. The company, originally founded in 1943, has a market cap of ₹17,533 Cr and key metrics including a P/E ratio of 29.00 and a dividend yield of 0.63%.

Overview:<BR>BASF India Ltd is a leading transnational company in the specialty chemicals industry, categorized as a small-cap firm.<BR><BR>History:<BR>BASF India Ltd was incorporated as 'R A Cole Private Limited' in 1943, changed its name to Indoplast Limited in 1963, and adopted its current name in February 1999. The latest quarterly results report net sales and profit for June 2026.<BR><BR>Financial Snapshot:<BR>- Net Sales: 4,824 Cr (Quarterly Results - Jun 2026)<BR>- Net Profit: 360 Cr (Quarterly Results - Jun 2026)<BR>- Market Cap: INR 17,533 Cr (Small Cap)<BR><BR>Key Metrics:<BR>- P/E: 29.00<BR>- Industry P/E: 27<BR>- Dividend Yield: 0.63%<BR>- Debt Equity: -0.19<BR>- Return on Equity: 10.36%<BR>- Price to Book: 4.37<BR><BR>Contact Details:<BR>Address: TheCapital A Wing 1204-C 12-Fl, C-70 G Blk BandraKurla Complex Mumbai Maharashtra : 400051<BR>Tel: 91-22-62785600<BR>Email: investor-grievance-india@basf.com<BR>Website: http://www.basf.com

View full answer

Who are the peers of the BASF India?

14-Aug-2026

BASF India's peers include Himadri Special, Deepak Nitrite, Aether Industries, Atul, Aarti Industries, Fine Organic, Vinati Organics, Privi Special, and Anupam Rasayan. In terms of management risk, growth, and capital structure, BASF India is rated as good, with a 1-year return of -10.24%.

Peers: The peers of BASF India are Himadri Special, Deepak Nitrite, Aether Industri., Atul, Aarti Industries, Fine Organic, Vinati Organics, Privi Speci., Anupam Rasayan.<BR><BR>Quality Snapshot: Excellent management risk is observed at Himadri Special, Fine Organic, Vinati Organics, and the rest. Good management risk is found at Deepak Nitrite, Atul, BASF India, and Privi Speci., while Average management risk is noted at Aether Industri. and Aarti Industries, and Below Average management risk is seen at Anupam Rasayan. Growth is Excellent for Himadri Special, Good for Privi Speci., Average for Aether Industri. and Fine Organic, while Below Average growth is noted at Deepak Nitrite, Atul, BASF India, Aarti Industries, and Vinati Organics. Anupam Rasayan has Average growth. Capital Structure is Excellent for Himadri Special, Deepak Nitrite, Aether Industri., Atul, BASF India, Fine Organic, and Vinati Organics, while Below Average is seen at Aarti Industries and Privi Speci., and Average at Anupam Rasayan.<BR><BR>Return Snapshot: Aether Industri. has the highest 1-year return at 110.16%, while Deepak Nitrite has the lowest at -9.13%. BASF India's 1-year return of -10.24% is lower than Deepak Nitrite's. Additionally, Vinati Organics and Anupam Rasayan have negative six-month returns.

View full answer

How big is BASF India?

14-Aug-2026

As of 14th August, BASF India Ltd has a market capitalization of 17,697.55 Cr, with net sales of 16,026.94 Cr and a net profit of 642.99 Cr in the latest four quarters. Specific values for Shareholder's Funds and Total Assets are not available.

As of 14th August, BASF India Ltd has a market capitalization of 17,697.55 Cr, categorizing it as a Small Cap company.<BR><BR>In the latest four quarters, BASF India reported net sales of 16,026.94 Cr and a net profit of 642.99 Cr.<BR><BR>The reporting period for the balance sheet data is the latest annual period, but specific values for Shareholder's Funds and Total Assets are not available.

View full answer

Are BASF India Ltd latest results good or bad?

05-Aug-2026

BASF India's Q1 FY27 results show strong growth, with a 40.08% increase in net sales and a 423.07% rise in net profit, indicating a positive turnaround. However, concerns about margin volatility and a below-industry average return on equity suggest investors should remain cautiously optimistic.

BASF India's latest results for Q1 FY27 can be seen as a positive turnaround, showcasing significant operational improvements. The company reported a remarkable 40.08% sequential increase in net sales, reaching ₹4,824.26 crores, and a staggering 423.07% growth in net profit, amounting to ₹360.29 crores. Additionally, the operating profit margin expanded sharply to 10.47%, up from just 3.23% in the previous quarter.<BR><BR>However, it's important to note that while these headline figures are impressive, there are underlying concerns regarding margin volatility and inconsistent operational performance. The operating margins have fluctuated significantly over the past several quarters, raising questions about the sustainability of the current performance levels. The average return on equity (ROE) of 12.87% is also below industry standards, indicating potential challenges in delivering consistent shareholder value.<BR><BR>In summary, while BASF India's latest results reflect strong growth and operational leverage, the volatility in margins and below-par ROE suggest that investors should approach with cautious optimism.

View full answer

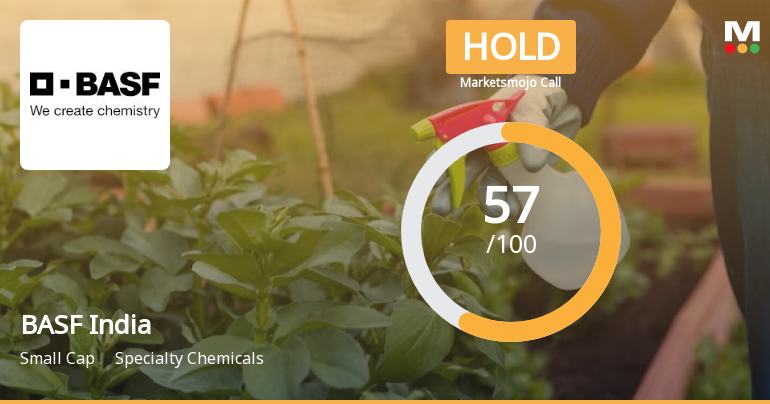
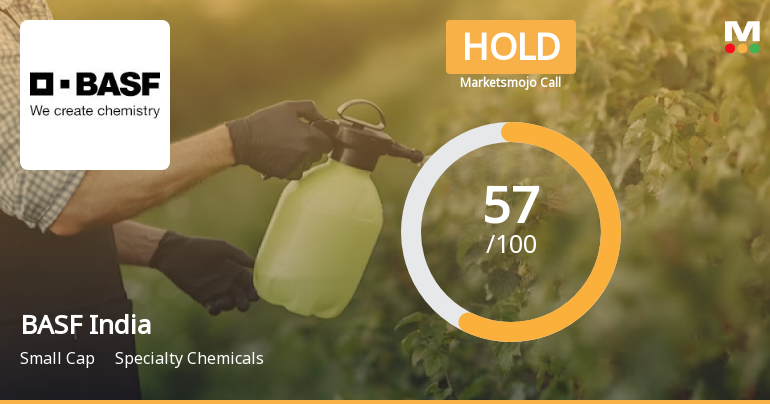
Should I buy, sell or hold BASF India Ltd?

05-Aug-2026

How has been the historical performance of BASF India?

14-Nov-2025

BASF India has shown significant growth in net sales, increasing from 1,626.99 crore in March 2010 to 15,260.00 crore in March 2025. However, profit metrics like operating profit, profit before tax, and earnings per share have fluctuated, indicating mixed performance despite overall revenue growth.

Answer:<BR>The historical performance of BASF India shows significant growth in net sales and profit over the years. <BR><BR>Breakdown:<BR>BASF India's net sales have increased from 1,626.99 crore in March 2010 to 15,260.00 crore in March 2025, demonstrating a strong upward trend. The total operating income has followed a similar trajectory, rising from 1,634.94 crore in March 2010 to 15,260.00 crore in March 2025. However, the operating profit (PBDIT) has seen fluctuations, peaking at 965.61 crore in March 2024 before declining to 812.89 crore in March 2025. Profit before tax also experienced a decline from 758.87 crore in March 2024 to 646.06 crore in March 2025, while profit after tax decreased from 563.27 crore to 479.06 crore in the same period. The earnings per share (EPS) have shown a decline from 130.12 in March 2024 to 110.66 in March 2025. Despite these fluctuations in profit metrics, the overall revenue growth indicates a robust business performance over the years.

View full answer

Is BASF India overvalued or undervalued?

20-Oct-2025

As of October 17, 2025, BASF India is considered undervalued with an attractive valuation grade, supported by a PE ratio of 47.93, an EV to EBITDA ratio of 28.64, and a strong long-term return of 219.85%, despite a year-to-date underperformance of -18.91% compared to the Sensex.

As of 17 October 2025, BASF India's valuation grade has moved from fair to attractive, indicating a positive shift in its market perception. The company is currently considered undervalued. Key ratios that support this assessment include a PE ratio of 47.93, an EV to EBITDA ratio of 28.64, and a ROCE of 20.00%. <BR><BR>In comparison to its peers, BASF India has a higher PE ratio than UPL, which stands at 37.91, and a more favorable EV to EBITDA ratio compared to Bayer CropScience at 30.04. Despite the recent underperformance against the Sensex with a year-to-date return of -18.91% compared to the Sensex's 7.44%, the long-term outlook remains strong with a 5-year return of 219.85%, reinforcing the notion that BASF India is currently undervalued in the specialty chemicals sector.

View full answer

Is BASF India technically bullish or bearish?

13-Oct-2025

As of October 10, 2025, BASF India is in a bearish trend with moderate strength, indicated by bearish MACD, moving averages, and Bollinger Bands on the weekly chart, along with a mildly bearish monthly outlook per Dow Theory.

As of 10 October 2025, the technical trend has changed from mildly bearish to bearish. The current stance is bearish with moderate strength. Key indicators driving this include a bearish MACD on the weekly chart, bearish moving averages on the daily timeframe, and bearish Bollinger Bands on the weekly chart. The KST is also bearish on the weekly timeframe, while the Dow Theory indicates no trend on the weekly but is mildly bearish on the monthly. Overall, the combination of these indicators suggests a bearish outlook for BASF India.

View full answer

Who are the top shareholders of the BASF India?

17-Jul-2025

The top shareholders of BASF India include BASF Societas Europea with 52.75%, mutual funds holding 3.34%, foreign institutional investors at 4.21%, and individual investors owning 11.51%. The largest public shareholder is Tata Mutual Fund, specifically through the Tata Small Cap Fund, with a 2.37% stake.

The top shareholders of BASF India include Basf Societas Europea, which holds the largest stake at 52.75%. Other significant shareholders are mutual funds, which collectively hold 3.34% through 20 different schemes, and foreign institutional investors (FIIs), who hold 4.21% across 119 entities. The highest public shareholder is Tata Mutual Fund, specifically through the Tata Small Cap Fund, with a holding of 2.37%. Additionally, individual investors collectively own 11.51% of the company.

View full answer

When is the next results date for BASF India?

06-Jun-2025

No Upcoming Board Meetings

Has BASF India declared dividend?

06-Jun-2025

Yes, BASF India Ltd has declared a 150% dividend, amounting to ₹15 per share, with an ex-date of July 26, 2024. The company has shown strong total returns over various periods, particularly a 336.66% total return over the last 5 years.

BASF India Ltd has declared a 150% dividend.<BR><BR>Dividend Details:<BR>- Percentage announced: 150%<BR>- Amount per share: 15<BR>- Ex-date: 26 Jul 24<BR><BR>Dividend Yield: 0.29%.<BR><BR>Total Returns by Period:<BR>In the last 6 months, BASF India experienced a price return of -11.4%, with no dividend return, resulting in a total return of -11.4%.<BR><BR>Over the past year, the company saw a price return of 15.05% and a dividend return of 0.32%, leading to a total return of 15.37%.<BR><BR>In the 2-year period, the price return was 98.19%, with a dividend return of 0.90%, culminating in a total return of 99.09%.<BR><BR>For the 3-year period, BASF India recorded a price return of 83.21%, a dividend return of 1.14%, and a total return of 84.35%.<BR><BR>In the last 4 years, the price return was 99.25%, with a dividend return of 1.33%, resulting in a total return of 100.58%.<BR><BR>Over the past 5 years, the company achieved a remarkable price return of 333.67%, a dividend return of 2.99%, leading to an impressive total return of 336.66%.<BR><BR>Overall, BASF India's recent dividend declaration reflects a commitment to returning value to shareholders, while the total returns over various periods indicate strong performance, particularly over the longer term.

View full answer
iScoreScore
Click here to find our call on this stock
Strong Sell
Sell
Hold
Buy
Strong Buy

Dashboard

1

The company is Net-Debt Free

 
2

Poor long term growth as Net Sales has grown by an annual rate of 8.60% and Operating profit at 1.63% over the last 5 years

 
3

With a growth in Net Profit of 162.22%, the company declared Very Positive results in Jun 26

4

With ROE of 10.4, it has a Fair valuation with a 4.4 Price to Book Value

5

Majority shareholders : Promoters

 
6

Underperformed the market in the last 1 year

stock-summaryMojo Parameters

Mojo Parameters

Loading Valuation Snapshot...

Stock DNA

stock-summary
Industry

Specialty Chemicals

stock-summary
Market cap

INR 17,336 Cr (Small Cap)

stock-summary
P/E

28.00

stock-summary
Industry P/E

27

stock-summary
Dividend Yield

0.62%

stock-summary
Debt Equity

-0.19

stock-summary
Return on Equity

10.36%

stock-summary
Price to Book

4.45

Revenue and Profits:
Net Sales:
4,824 Cr
(Quarterly Results - Jun 2026)
Net Profit:
360 Cr
stock-summaryTotal Returns
Total Returns (Price + Dividend) stock-summary
Dividend Yield (0.62%)
TimePeriod
Price Return
Dividend Return
Total Return
3 Months
4.12%
0.66%
4.78%
6 Months
9.64%
0.68%
10.32%
1 Year
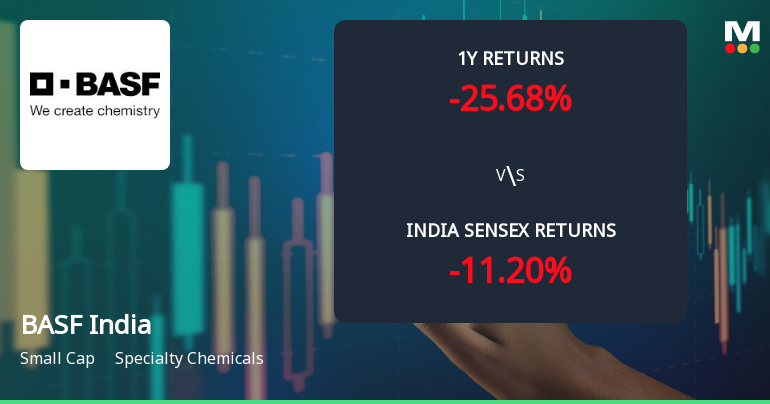
-11.55%
0.54%
-11.01%
2 Years
-39.31%
0.64%
-38.67%
3 Years
59.59%
2.25%
61.84%
4 Years
22.16%
2.10%
24.26%
5 Years
11.96%
2.16%
14.12%

Latest dividend: 25 per share ex-dividend date: Jul-30-2026

Risk Adjusted Returns v/s stock-summary
Returns Beta
Icon
Beta has not been calculated since enough price history is not available
stock-summaryNews & Corporate Actions

News

Announcements stock-summary

Shareholder Meeting / Postal Ballot-Scrutinizers Report

13-Aug-2026 | Source : BSE

Scrutinizers Report and the Voting Results in respect of the proposals considered at the 82nd Annual General Meeting of the Company held on 12th August 2026

Presentation At The 82Nd AGM Held On Wednesday 12Th August 2026 At 3.00 P.M

12-Aug-2026 | Source : BSE

Presentation at the 82nd AGM held on Wednesday 12th August 2026 at 3.00 P.M

Shareholder Meeting / Postal Ballot-Outcome of AGM

12-Aug-2026 | Source : BSE

Proceedings of the 82nd Annual General Meeting held on Wednesday 12th August 2026

Corporate Actions stock-summary

stock-summary
BOARD MEETING

No Upcoming Board Meetings

stock-summary
DIVIDEND

BASF India Ltd has declared 250% dividend, ex-date: 30 Jul 26

stock-summary
SPLITS

No Splits history available

stock-summary
BONUS

No Bonus history available

stock-summary
RIGHTS

No Rights history available

stock-summaryKey Factors

Quality key factors stock-summary

Factor
Value
Sales Growth (5y)
8.60%
EBIT Growth (5y)
1.63%
EBIT to Interest (avg)
30.14
Debt to EBITDA (avg)
0.18
Net Debt to Equity (avg)
-0.19
Sales to Capital Employed (avg)
4.42
Tax Ratio
26.65%
Dividend Payout Ratio
17.34%
Pledged Shares
0
Institutional Holding
11.50%
ROCE (avg)
22.89%
ROE (avg)
12.87%

Valuation key factors

Factor
Value
P/E Ratio
28
Industry P/E
27
Price to Book Value
4.45
EV to EBIT
21.28
EV to EBITDA
17.91
EV to Capital Employed
5.24
EV to Sales
1.05
PEG Ratio
0.55
Dividend Yield
0.61%
ROCE (Latest)
15.62%
ROE (Latest)
10.36%

Technicals key factors

Indicator
Weekly
Monthly
MACD
Bullish
Bearish
RSI
No Signal
No Signal
Bollinger Bands
Mildly Bullish
Mildly Bearish
Moving Averages
Mildly Bearish (Daily)
KST
Bullish
Bearish
Dow Theory
No Trend
Mildly Bullish
OBV
No Trend
Bullish
stock-summary Technical Indicator Scale: Bearish, Mildly Bearish, Sideways, Mildly Bullish, Bullish  Turned 
stock-summaryShareholding
Shareholding Snapshot : Jun 2026stock-summary
Shareholding Compare (%holding) stock-summary
Majority shareholders

Promoters

Pledged Promoter Holdings

None

Mutual Funds

Held by 7 Schemes (2.71%)

FIIs

Held by 113 FIIs (5.21%)

Promoter with highest holding

Basf Schweiz Ag (20.58%)

Highest Public shareholder

Tata Mutual Fund - Tata Small Cap Fund (2.37%)

Individual Investors Holdings

11.4%

stock-summaryFinancial
[
  {
    "link": "quarterly",
    "btn_text": "All Quarterly Results",
    "header": "Quarterly Results Snapshot (Consolidated) - Jun'26 - YoY",
    "rhs": [
      {
        "prefix": "Net Sales ",
        "suffix": "YoY Growth in quarter ended Jun 2026 is 24.51% vs -2.33% in Jun 2025",
        "dir": 1
      },
      {
        "prefix": "Consolidated Net Profit ",
        "suffix": "YoY Growth in quarter ended Jun 2026 is 162.22% vs -37.71% in Jun 2025",
        "dir": 1
      }
    ],
    "table": {
      "header": [
        "Jun'26",
        "Jun'25",
        "Change(%)"
      ],
      "body": [
        {
          "field": "Net Sales",
          "val1": "4,824.26",
          "val2": "3,874.54",
          "chgp": "24.51%",
          "chgp_class": "positive"
        },
        {
          "field": "Operating Profit (PBDIT) excl Other Income",
          "val1": "504.43",
          "val2": "213.95",
          "chgp": "135.77%",
          "chgp_class": "positive"
        },
        {
          "field": "Interest",
          "val1": "5.21",
          "val2": "4.87",
          "chgp": "6.98%",
          "chgp_class": "negative"
        },
        {
          "field": "Exceptional Items",
          "val1": "12.47",
          "val2": "0.00",
          "chgp": "",
          "chgp_class": "neutral"
        },
        {
          "field": "Consolidate Net Profit",
          "val1": "360.29",
          "val2": "137.40",
          "chgp": "162.22%",
          "chgp_class": "positive"
        },
        {
          "field": "Operating Profit Margin (Excl OI)",
          "val1": "10.47%",
          "val2": "5.52%",
          "chgp": "4.95%",
          "chgp_class": "positive"
        }
      ]
    }
  },
  {
    "link": "half-yearly",
    "btn_text": "All Half Yearly Results",
    "header": "Half Yearly Results Snapshot (Consolidated) - Sep'25",
    "rhs": [
      {
        "prefix": "Net Sales ",
        "suffix": "Not Applicable: The company has declared_date for only one period",
        "dir": 0
      },
      {
        "prefix": "Consolidated Net Profit ",
        "suffix": "Not Applicable: The company has declared_date for only one period",
        "dir": 0
      }
    ],
    "table": {
      "header": [
        "Sep'25",
        "Sep'24",
        "Change(%)"
      ],
      "body": [
        {
          "field": "Net Sales",
          "val1": "7,919.87",
          "val2": "8,214.62",
          "chgp": "-3.59%",
          "chgp_class": "negative"
        },
        {
          "field": "Operating Profit (PBDIT) excl Other Income",
          "val1": "380.31",
          "val2": "513.32",
          "chgp": "-25.91%",
          "chgp_class": "negative"
        },
        {
          "field": "Interest",
          "val1": "12.90",
          "val2": "7.77",
          "chgp": "66.02%",
          "chgp_class": "negative"
        },
        {
          "field": "Exceptional Items",
          "val1": "0.00",
          "val2": "13.78",
          "chgp": "-100.00%",
          "chgp_class": "negative"
        },
        {
          "field": "Consolidate Net Profit",
          "val1": "244.55",
          "val2": "348.50",
          "chgp": "-29.83%",
          "chgp_class": "negative"
        },
        {
          "field": "Operating Profit Margin (Excl OI)",
          "val1": "4.80%",
          "val2": "6.25%",
          "chgp": "-1.45%",
          "chgp_class": "negative"
        }
      ]
    }
  },
  {
    "link": "nine-monthly",
    "btn_text": "All Nine Monthly Results",
    "header": "Nine Monthly Results Snapshot (Consolidated) - Dec'25",
    "rhs": [
      {
        "prefix": "Net Sales ",
        "suffix": "YoY Growth in nine months ended Dec 2025 is -0.56% vs 75.48% in Dec 2024",
        "dir": -1
      },
      {
        "prefix": "Consolidated Net Profit ",
        "suffix": "YoY Growth in nine months ended Dec 2025 is -22.31% vs -9.01% in Dec 2024",
        "dir": -1
      }
    ],
    "table": {
      "header": [
        "Dec'25",
        "Dec'24",
        "Change(%)"
      ],
      "body": [
        {
          "field": "Net Sales",
          "val1": "11,782.91",
          "val2": "11,849.84",
          "chgp": "-0.56%",
          "chgp_class": "negative"
        },
        {
          "field": "Operating Profit (PBDIT) excl Other Income",
          "val1": "550.75",
          "val2": "683.16",
          "chgp": "-19.38%",
          "chgp_class": "negative"
        },
        {
          "field": "Interest",
          "val1": "17.54",
          "val2": "11.99",
          "chgp": "46.29%",
          "chgp_class": "negative"
        },
        {
          "field": "Exceptional Items",
          "val1": "0.71",
          "val2": "12.32",
          "chgp": "-94.24%",
          "chgp_class": "negative"
        },
        {
          "field": "Consolidate Net Profit",
          "val1": "351.22",
          "val2": "452.05",
          "chgp": "-22.31%",
          "chgp_class": "negative"
        },
        {
          "field": "Operating Profit Margin (Excl OI)",
          "val1": "4.67%",
          "val2": "5.77%",
          "chgp": "-1.10%",
          "chgp_class": "negative"
        }
      ]
    }
  },
  {
    "link": "annual",
    "btn_text": "All Annual Results",
    "header": "Annual Results Snapshot (Consolidated) - Mar'26",
    "rhs": [
      {
        "prefix": "Net Sales ",
        "suffix": "YoY Growth in year ended Mar 2026 is 1.11% vs 7.36% in Mar 2025",
        "dir": -1
      },
      {
        "prefix": "Consolidated Net Profit ",
        "suffix": "YoY Growth in year ended Mar 2026 is -12.31% vs -14.95% in Mar 2025",
        "dir": 1
      }
    ],
    "table": {
      "header": [
        "Mar'26",
        "Mar'25",
        "Change(%)"
      ],
      "body": [
        {
          "field": "Net Sales",
          "val1": "14,944.00",
          "val2": "14,780.36",
          "chgp": "1.11%",
          "chgp_class": "positive"
        },
        {
          "field": "Operating Profit (PBDIT) excl Other Income",
          "val1": "659.73",
          "val2": "730.14",
          "chgp": "-9.64%",
          "chgp_class": "negative"
        },
        {
          "field": "Interest",
          "val1": "19.12",
          "val2": "15.37",
          "chgp": "24.40%",
          "chgp_class": "negative"
        },
        {
          "field": "Exceptional Items",
          "val1": "3.87",
          "val2": "24.49",
          "chgp": "-84.20%",
          "chgp_class": "negative"
        },
        {
          "field": "Consolidate Net Profit",
          "val1": "420.10",
          "val2": "479.06",
          "chgp": "-12.31%",
          "chgp_class": "negative"
        },
        {
          "field": "Operating Profit Margin (Excl OI)",
          "val1": "4.42%",
          "val2": "4.94%",
          "chgp": "-0.52%",
          "chgp_class": "negative"
        }
      ]
    }
  }
]

Quarterly Results Snapshot (Consolidated) - Jun'26 - YoYstock-summary

Jun'26
Jun'25
Change(%)
Net Sales
4,824.26
3,874.54
24.51%
Operating Profit (PBDIT) excl Other Income
504.43
213.95
135.77%
Interest
5.21
4.87
6.98%
Exceptional Items
12.47
0.00
Consolidate Net Profit
360.29
137.40
162.22%
Operating Profit Margin (Excl OI)
10.47%
5.52%
4.95%
Values in Rs Cr.
Direction Arrows
Net Sales

YoY Growth in quarter ended Jun 2026 is 24.51% vs -2.33% in Jun 2025

Direction Arrows
Consolidated Net Profit

YoY Growth in quarter ended Jun 2026 is 162.22% vs -37.71% in Jun 2025

Half Yearly Results Snapshot (Consolidated) - Sep'25stock-summary

Sep'25
Sep'24
Change(%)
Net Sales
7,919.87
8,214.62
-3.59%
Operating Profit (PBDIT) excl Other Income
380.31
513.32
-25.91%
Interest
12.90
7.77
66.02%
Exceptional Items
0.00
13.78
-100.00%
Consolidate Net Profit
244.55
348.50
-29.83%
Operating Profit Margin (Excl OI)
4.80%
6.25%
-1.45%
Values in Rs Cr.
Net Sales

Not Applicable: The company has declared_date for only one period

Consolidated Net Profit

Not Applicable: The company has declared_date for only one period

Nine Monthly Results Snapshot (Consolidated) - Dec'25stock-summary

Dec'25
Dec'24
Change(%)
Net Sales
11,782.91
11,849.84
-0.56%
Operating Profit (PBDIT) excl Other Income
550.75
683.16
-19.38%
Interest
17.54
11.99
46.29%
Exceptional Items
0.71
12.32
-94.24%
Consolidate Net Profit
351.22
452.05
-22.31%
Operating Profit Margin (Excl OI)
4.67%
5.77%
-1.10%
Values in Rs Cr.
Direction Arrows
Net Sales

YoY Growth in nine months ended Dec 2025 is -0.56% vs 75.48% in Dec 2024

Direction Arrows
Consolidated Net Profit

YoY Growth in nine months ended Dec 2025 is -22.31% vs -9.01% in Dec 2024

Annual Results Snapshot (Consolidated) - Mar'26stock-summary

Mar'26
Mar'25
Change(%)
Net Sales
14,944.00
14,780.36
1.11%
Operating Profit (PBDIT) excl Other Income
659.73
730.14
-9.64%
Interest
19.12
15.37
24.40%
Exceptional Items
3.87
24.49
-84.20%
Consolidate Net Profit
420.10
479.06
-12.31%
Operating Profit Margin (Excl OI)
4.42%
4.94%
-0.52%
Values in Rs Cr.
Direction Arrows
Net Sales

YoY Growth in year ended Mar 2026 is 1.11% vs 7.36% in Mar 2025

Direction Arrows
Consolidated Net Profit

YoY Growth in year ended Mar 2026 is -12.31% vs -14.95% in Mar 2025

stock-summaryCompany CV
About BASF India Ltd stock-summary
stock-summary
BASF India Ltd
Small Cap
Specialty Chemicals
BASF India Limited, the flagship company of the BASF Group in India was incorporated as 'R A Cole Private Limited' on May 13, 1943 and the name was changed to Indoplast Limited in January, 1963. The Company got their name changed to BASF India Limited in February, 1999. BASF India Limited is a leading transnational company in the Indian chemical industry.
Company Coordinates stock-summary
Company Details
TheCapital A Wing 1204-C 12-Fl, C-70 G Blk BandraKurla Complex Mumbai Maharashtra : 400051
stock-summary
Tel: 91-22-62785600
stock-summary
investor-grievance-india@basf.com/p
Registrar Details
TSR Darashaw Ltd, 6-10 , Haji Moosa Patrawala Indl. Est , 20 Dr.E.Moses Road , Mahalaxmi , Mumbai