
Compare BASF India with Similar Stocks
Stock DNA
Specialty Chemicals
INR 16,236 Cr (Small Cap)
39.00
29
0.56%
-0.19
10.36%
3.91
Total Returns (Price + Dividend) 
Latest dividend: 20 per share ex-dividend date: Jul-30-2025
Risk Adjusted Returns v/s
Returns Beta

News

BASF India Ltd is Rated Sell by MarketsMOJO
BASF India Ltd is rated 'Sell' by MarketsMOJO, with this rating last updated on 20 May 2026. However, the analysis and financial metrics discussed here reflect the stock's current position as of 23 June 2026, providing investors with the latest insights into the company’s performance and outlook.
Read full news article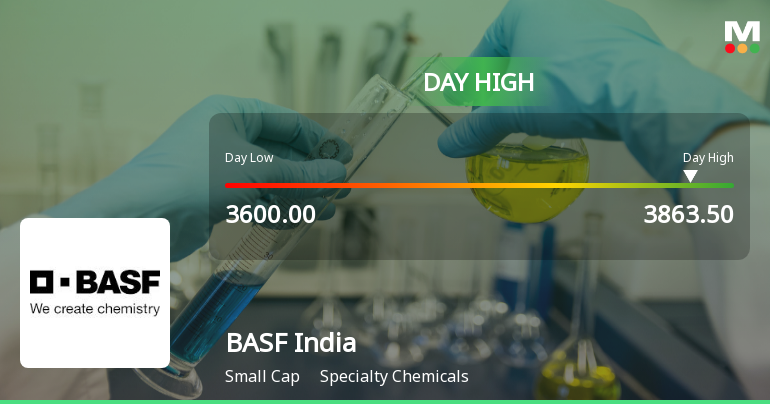
BASF India Ltd Surges 7.65% to Day's High of Rs 3760 — Outperforms Sector by 4.52 Percentage Points
The Sensex edged up 0.11% on 23 Jun 2026, while BASF India Ltd surged 7.65%, outperforming its Specialty Chemicals sector by 4.52 percentage points. This sharp single-session gain rewrites the short-term narrative for the small-cap stock, which has been on a steady three-day winning streak.
Read full news article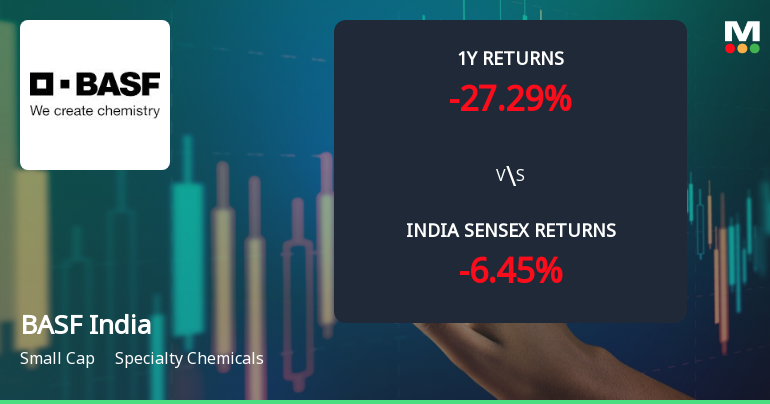
BASF India Ltd Technical Momentum Shifts Amid Mixed Indicator Signals
BASF India Ltd has exhibited a nuanced shift in its technical momentum, moving from a bearish stance to a mildly bearish trend, reflecting a complex interplay of indicator signals. Despite a 2.31% gain on 23 Jun 2026, the stock’s technical landscape reveals mixed signals across weekly and monthly timeframes, challenging investors to carefully weigh momentum against broader market conditions.
Read full news article Announcements
Announcement under Regulation 30 (LODR)-Analyst / Investor Meet - Outcome
27-May-2026 | Source : BSETranscript of the Analyst / Fund Managers meeting of BASF India Limited held on 22nd May 2026 at 4 pm through Audio Visual means.
Announcement under Regulation 30 (LODR)-Analyst / Investor Meet - Outcome
23-May-2026 | Source : BSERecording of the Analyst/Fund managers meet of BASF India Limited held on 22nd May 2026
Announcement under Regulation 30 (LODR)-Newspaper Publication
23-May-2026 | Source : BSENewspaper Publication regarding the Notice of the NCLT convened meeting of Equity Shareholders of BASF India Limited to be held on 24th June 2026 at 3.30 PM IST through Audio Visual Means.
Corporate Actions

04 Aug 2026

BASF India Ltd has declared 250% dividend, ex-date: 30 Jul 26

No Splits history available

No Bonus history available

No Rights history available
Quality key factors
Valuation key factors
Technicals key factors
 Technical Indicator Scale: Bearish, Mildly Bearish, Sideways, Mildly Bullish, Bullish Turned
 Shareholding Snapshot : Mar 2026
Shareholding Compare (%holding)
Promoters
None
Held by 10 Schemes (2.86%)
Held by 118 FIIs (5.34%)
Basf Societas Europaea (52.75%)
Tata Mutual Fund - Tata Small Cap Fund (2.37%)
11.23%
Quarterly Results Snapshot (Consolidated) - Mar'26 - YoY

YoY Growth in quarter ended Mar 2026 is 4.78% vs -2.18% in Mar 2025
YoY Growth in quarter ended Mar 2026 is 155.02% vs -83.27% in Mar 2025
Half Yearly Results Snapshot (Consolidated) - Sep'25
Not Applicable: The company has declared_date for only one period
Not Applicable: The company has declared_date for only one period
Nine Monthly Results Snapshot (Consolidated) - Dec'25

YoY Growth in nine months ended Dec 2025 is -0.56% vs 75.48% in Dec 2024
YoY Growth in nine months ended Dec 2025 is -22.31% vs -9.01% in Dec 2024
Annual Results Snapshot (Consolidated) - Mar'26
YoY Growth in year ended Mar 2026 is 1.11% vs 7.36% in Mar 2025
YoY Growth in year ended Mar 2026 is -12.31% vs -14.95% in Mar 2025
About BASF India Ltd

Company Coordinates


