
Compare Atul with Similar Stocks
Stock DNA
Specialty Chemicals
INR 20,126 Cr (Small Cap)
25.00
44
0.44%
-0.25
10.90%
3.24
Total Returns (Price + Dividend) 
Latest dividend: 29.96951913385571 per share ex-dividend date: Jul-17-2026
Risk Adjusted Returns v/s
Returns Beta

News
Atul Ltd. Technical Momentum Shifts Signal Bullish Outlook Amid Market Volatility
Atul Ltd., a specialty chemicals company, has witnessed a notable shift in its technical momentum, upgrading its MarketsMOJO grade from Hold to Buy on 27 July 2026. Despite a 2.04% decline in the latest session, the stock’s underlying technical indicators suggest a strengthening bullish trend, positioning it favourably against broader market volatility and sector dynamics.
Read full news article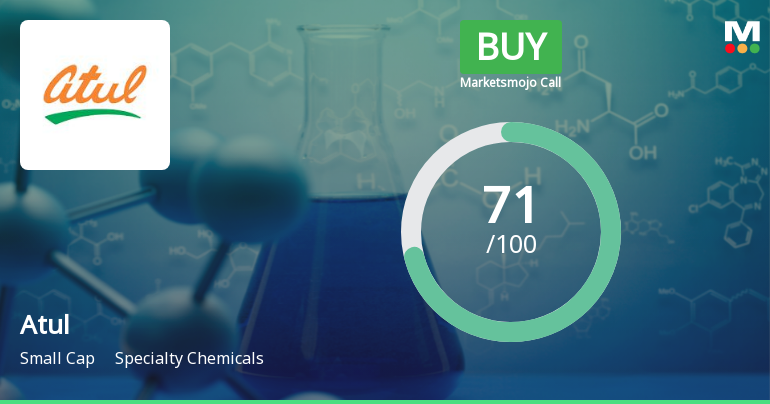
Atul Ltd. Upgraded to Buy by MarketsMOJO on Strong Financial and Quality Metrics
Atul Ltd., a key player in the specialty chemicals sector, has seen its investment rating upgraded from Hold to Buy, reflecting a marked improvement across financial performance, quality metrics, valuation, and technical indicators. This upgrade, effective from 27 July 2026, follows a series of robust quarterly results and positive market momentum, positioning the company favourably amid a challenging industry backdrop.
Read full news article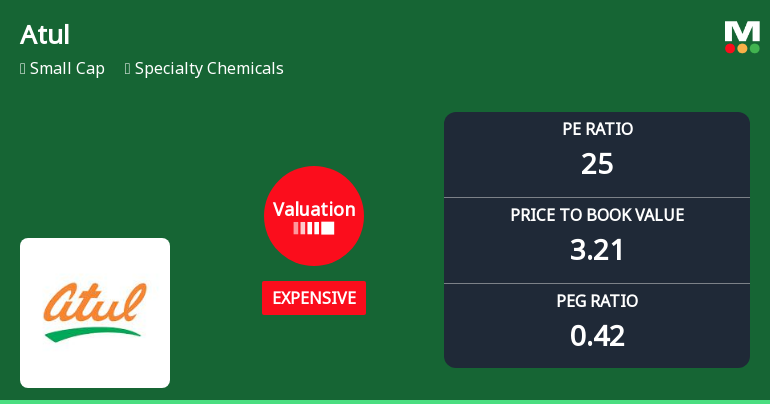
Atul Ltd. Valuation Shifts Signal Changing Market Sentiment in Specialty Chemicals
Atul Ltd., a prominent player in the specialty chemicals sector, has experienced a notable shift in its valuation parameters, moving from a fair to an expensive rating. This change reflects evolving market perceptions and has implications for investors assessing the stock’s price attractiveness relative to its historical averages and peer group.
Read full news article Announcements
Announcement under Regulation 30 (LODR)-Newspaper Publication
25-Jul-2026 | Source : BSELetter Attached
June 30 2026
24-Jul-2026 | Source : BSELetter attached
Letter Attached
24-Jul-2026 | Source : BSEletter attached
Corporate Actions

No Upcoming Board Meetings

Atul Ltd. has declared 300% dividend, ex-date: 17 Jul 26

No Splits history available

No Bonus history available

No Rights history available
Quality key factors
Valuation key factors
Technicals key factors
 Technical Indicator Scale: Bearish, Mildly Bearish, Sideways, Mildly Bullish, Bullish Turned
 Shareholding Snapshot : Jun 2026
Shareholding Compare (%holding)
Promoters
0.9741
Held by 24 Schemes (14.08%)
Held by 140 FIIs (7.44%)
Aagam Holdings Private Limited (22.6%)
Life Insurance Corporation Of India (5.44%)
16.59%
Quarterly Results Snapshot (Consolidated) - Jun'26 - QoQ

QoQ Growth in quarter ended Jun 2026 is 10.65% vs 6.13% in Mar 2026

QoQ Growth in quarter ended Jun 2026 is 16.73% vs 30.74% in Mar 2026
Half Yearly Results Snapshot (Consolidated) - Sep'25
Growth in half year ended Sep 2025 is 11.60% vs 14.28% in Sep 2024
Growth in half year ended Sep 2025 is 23.45% vs 28.41% in Sep 2024
Nine Monthly Results Snapshot (Consolidated) - Dec'25
YoY Growth in nine months ended Dec 2025 is 11.42% vs 17.59% in Dec 2024
YoY Growth in nine months ended Dec 2025 is 30.86% vs 35.08% in Dec 2024
Annual Results Snapshot (Consolidated) - Mar'26
YoY Growth in year ended Mar 2026 is 12.36% vs 18.15% in Mar 2025
YoY Growth in year ended Mar 2026 is 40.08% vs 49.81% in Mar 2025
About Atul Ltd.

Company Coordinates


