
Compare Deepak Nitrite with Similar Stocks
Dashboard
High Management Efficiency with a high ROE of 18.20%
Company has a Debt to Equity ratio (avg) of 0.05 times
Poor long term growth as Operating profit has grown by an annual rate -7.13% of over the last 5 years
The company has declared positive results in Mar'2026 after 3 consecutive negative quarters
With ROCE of 10.8, it has a Expensive valuation with a 3.4 Enterprise value to Capital Employed
High Institutional Holdings at 30.01%
Below par performance in long term as well as near term
Stock DNA
Specialty Chemicals
INR 22,351 Cr (Small Cap)
40.00
13
0.92%
0.20
9.59%
3.83
Total Returns (Price + Dividend) 
Latest dividend: 7.494419642857143 per share ex-dividend date: Jul-27-2026
Risk Adjusted Returns v/s
Returns Beta

News

Deepak Nitrite Ltd. Technical Momentum Shifts Amid Mixed Market Signals
Deepak Nitrite Ltd., a key player in the specialty chemicals sector, has experienced a notable shift in its technical momentum, moving from a mildly bullish stance to a sideways trend. Recent technical indicators reveal a complex picture, with mixed signals from MACD, RSI, moving averages, and other momentum oscillators, reflecting the stock’s cautious near-term outlook despite a Hold rating upgrade.
Read full news article
Deepak Nitrite Ltd. is Rated Hold by MarketsMOJO
Deepak Nitrite Ltd. is rated 'Hold' by MarketsMOJO, with this rating last updated on 07 Jul 2026. While the rating change occurred on that date, the analysis and financial metrics discussed here reflect the stock's current position as of 30 July 2026, providing investors with an up-to-date view of the company’s fundamentals, returns, and market standing.
Read full news article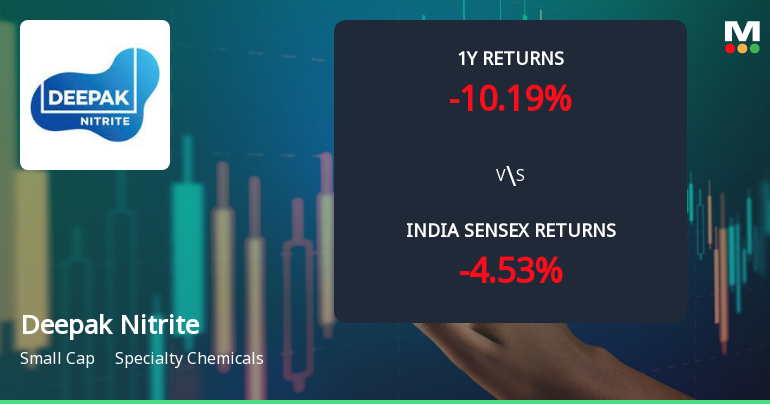
Deepak Nitrite Ltd. Technical Momentum Shifts Signal Mild Bullish Outlook
Deepak Nitrite Ltd., a specialty chemicals company, has exhibited a notable shift in its technical momentum, moving from a sideways trend to a mildly bullish stance. This change is underscored by a combination of technical indicators including MACD, RSI, moving averages, and Bollinger Bands, suggesting a cautiously optimistic outlook for investors amid mixed signals from longer-term trend measures.
Read full news article Announcements
Disclosure Under Regulation 30 Of SEBI (LODR) Regulations 2015
28-Jul-2026 | Source : BSEDisclosure under Regulation 30 of SEBI (LODR) Regulations 2015
Schedule Of Q1 & FY 2027 Earnings Conference Call
24-Jul-2026 | Source : BSESchedule of Q1 & FY 2027 Earnings Con Call
Disclosure Under Regulation 30 Of SEBI (LODR) Regulations 2015
23-Jul-2026 | Source : BSEDisclosure under Regulation 30 of SEBI (LODR) Regulations 2015
Corporate Actions

04 Aug 2026

Deepak Nitrite Ltd. has declared 375% dividend, ex-date: 27 Jul 26

Deepak Nitrite Ltd. has announced 2:10 stock split, ex-date: 20 Jun 14

Deepak Nitrite Ltd. has announced 1:1 bonus issue, ex-date: 20 Jun 14

Deepak Nitrite Ltd. has announced 2:4 rights issue, ex-date: 21 Feb 06
Quality key factors
Valuation key factors
Technicals key factors
 Technical Indicator Scale: Bearish, Mildly Bearish, Sideways, Mildly Bullish, Bullish Turned
 Shareholding Snapshot : Jun 2026
Shareholding Compare (%holding)
Promoters
None
Held by 25 Schemes (11.45%)
Held by 154 FIIs (6.25%)
Deepak Chimanlal Mehta (16.56%)
Life Insurance Corporation Of India (9.47%)
18.16%
Quarterly Results Snapshot (Consolidated) - Mar'26 - QoQ

QoQ Growth in quarter ended Mar 2026 is 7.36% vs 3.84% in Dec 2025
QoQ Growth in quarter ended Mar 2026 is 120.20% vs -15.94% in Dec 2025
Half Yearly Results Snapshot (Consolidated) - Sep'25

Growth in half year ended Sep 2025 is -9.69% vs 18.40% in Sep 2024
Growth in half year ended Sep 2025 is -41.79% vs 11.76% in Sep 2024
Nine Monthly Results Snapshot (Consolidated) - Dec'25
YoY Growth in nine months ended Dec 2025 is -5.50% vs 9.84% in Dec 2024
YoY Growth in nine months ended Dec 2025 is -33.17% vs -11.17% in Dec 2024
Annual Results Snapshot (Consolidated) - Mar'26
YoY Growth in year ended Mar 2026 is -4.77% vs 7.81% in Mar 2025
YoY Growth in year ended Mar 2026 is -21.04% vs -14.02% in Mar 2025
About Deepak Nitrite Ltd.

Company Coordinates


