
Compare Kanco Tea with Similar Stocks
Dashboard
With a Operating Losses, the company has a Weak Long Term Fundamental Strength
- Company's ability to service its debt is weak with a poor EBIT to Interest (avg) ratio of -0.62
- The company has been able to generate a Return on Equity (avg) of 5.44% signifying low profitability per unit of shareholders funds
- PAT(Q) At Rs -14.08 cr has Fallen at -44.0%
- INTEREST(9M) At Rs 3.20 cr has Grown at 31.69%
- PBT LESS OI(Q) At Rs -15.79 cr has Fallen at -19.53%
Risky - Negative EBITDA
Below par performance in long term as well as near term
Total Returns (Price + Dividend) 
Latest dividend: 0.9861882193635748 per share ex-dividend date: Jul-20-2023
Risk Adjusted Returns v/s
Returns Beta

News
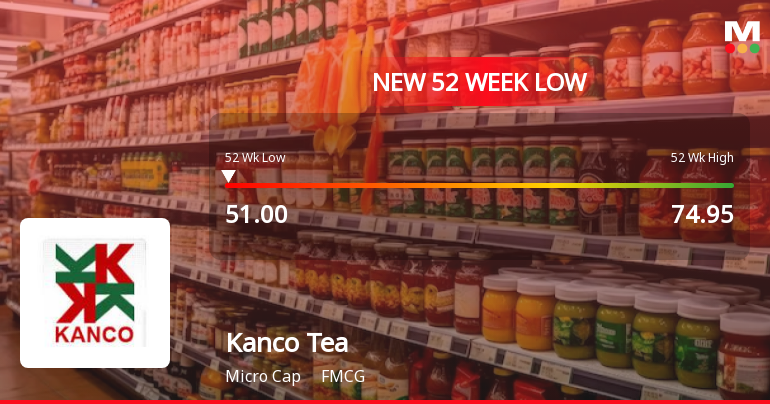
Kanco Tea & Industries Ltd Falls to 52-Week Low of Rs 51 as Sell-Off Deepens
For the fourth consecutive session, Kanco Tea & Industries Ltd has closed lower, culminating in a fresh 52-week low of Rs 51 on 29 Jun 2026. This marks a near 8% decline over the past four days, underscoring persistent selling pressure despite a broadly resilient market backdrop.
Read full news articleAre Kanco Tea & Industries Ltd latest results good or bad?
Kanco Tea & Industries Ltd's latest financial results for Q4 FY26 reveal significant operational challenges and a deteriorating financial position. The company reported a net loss of ₹14.08 crores, which reflects a 43.97% decline year-on-year. Revenue for the quarter plummeted to ₹2.73 crores, marking a 90.32% sequential decrease and a 36.07% drop compared to the same quarter last year. This sharp decline in revenue indicates both seasonal weakness and deeper structural issues within the business. The operating margin was recorded at a staggering -510.99%, the worst on record for the company, highlighting an unsustainable cost structure. Employee costs alone amounted to ₹10.18 crores, exceeding total revenue by nearly four times, which raises serious concerns about the viability of the business model. The persistent operational inefficiencies suggest that Kanco Tea is facing an acute crisis that requires i...
Read full news article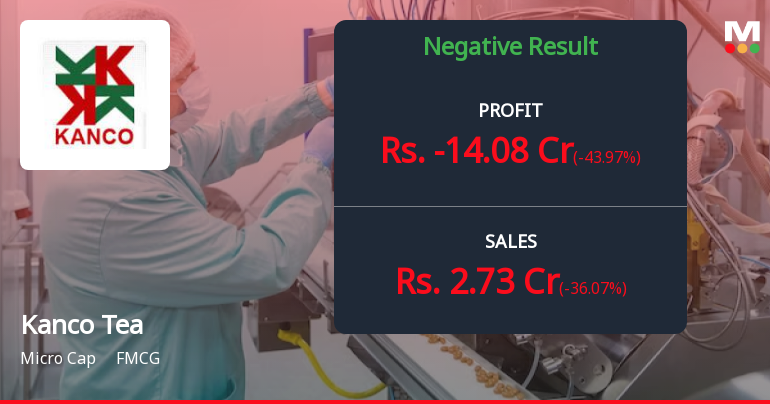
Kanco Tea Q4 FY26: Devastating Losses Mount as Operational Crisis Deepens
Kanco Tea & Industries Ltd., a Kolkata-based plantation and black tea manufacturer, reported catastrophic quarterly results for Q4 FY26, posting a net loss of ₹14.08 crores compared to a loss of ₹9.78 crores in the same quarter last year—a deterioration of 43.97%. The company's operational crisis has intensified dramatically, with revenue collapsing 90.32% quarter-on-quarter to just ₹2.73 crores, whilst operating margins plummeted to a shocking -510.99%, signalling severe distress in the core business.
Read full news article Announcements
Closure of Trading Window
22-Jun-2026 | Source : BSEIntimation for closure of Trading Window
Announcement Under Regulation 30
19-Jun-2026 | Source : BSECertificate on re-lodgemnet of transfer requests.
Announcement Under Regulation 30- Saksham Niveshak
09-Jun-2026 | Source : BSEIntimation to shareholders whose dividends remain unclaimed/unpaid under second 100 days Campaign- Saksham Niveshak.
Corporate Actions

No Upcoming Board Meetings

Kanco Tea & Industries Ltd has declared 10% dividend, ex-date: 20 Jul 23

No Splits history available

Kanco Tea & Industries Ltd has announced 2:1 bonus issue, ex-date: 22 Aug 17

No Rights history available
Quality key factors
Valuation key factors
Technicals key factors
 Technical Indicator Scale: Bearish, Mildly Bearish, Sideways, Mildly Bullish, Bullish Turned
 Shareholding Snapshot : Mar 2026
Shareholding Compare (%holding)
Promoters
None
Held by 4 Schemes (0.31%)
Held by 0 FIIs
E T Resources Pvt Ltd (17.13%)
Sangeetha S (3.47%)
23.75%
Quarterly Results Snapshot (Consolidated) - Mar'26 - YoY

YoY Growth in quarter ended Mar 2026 is -36.07% vs 32.20% in Mar 2025
YoY Growth in quarter ended Mar 2026 is -43.97% vs -5.27% in Mar 2025
Half Yearly Results Snapshot (Consolidated) - Sep'25

Growth in half year ended Sep 2025 is 9.37% vs -24.66% in Sep 2024
Growth in half year ended Sep 2025 is 88.09% vs 43.05% in Sep 2024
Nine Monthly Results Snapshot (Consolidated) - Dec'25
YoY Growth in nine months ended Dec 2025 is 22.27% vs -19.05% in Dec 2024
YoY Growth in nine months ended Dec 2025 is 499.31% vs 220.00% in Dec 2024
Annual Results Snapshot (Consolidated) - Mar'26
YoY Growth in year ended Mar 2026 is 18.35% vs -16.88% in Mar 2025
YoY Growth in year ended Mar 2026 is 34.53% vs 5.66% in Mar 2025
About Kanco Tea & Industries Ltd

Company Coordinates


