
Compare Polylink Poly. with Similar Stocks
Dashboard
Weak Long Term Fundamental Strength with an average Return on Equity (ROE) of 4.65%
- Poor long term growth as Operating profit has grown by an annual rate 5.56% of over the last 5 years
- Company's ability to service its debt is weak with a poor EBIT to Interest (avg) ratio of 1.71
Flat results in Mar 26
Underperformed the market in the last 1 year
Total Returns (Price + Dividend) 
Polylink Poly. for the last several years.
Risk Adjusted Returns v/s
Returns Beta

News
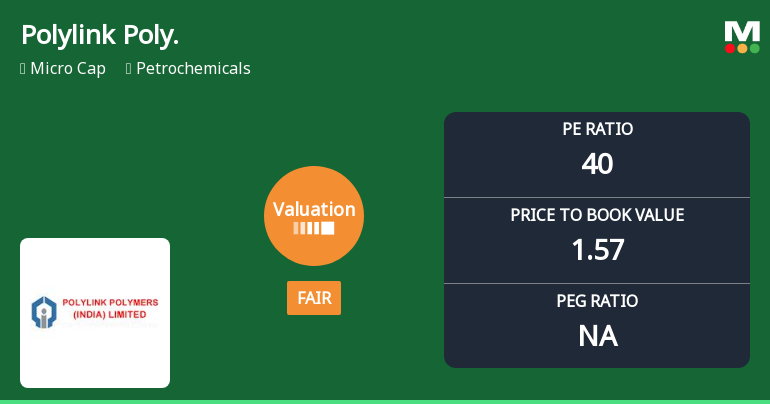
Polylink Polymers Valuation Shifts to Fair Amid Mixed Performance in Petrochemicals Sector
Polylink Polymers (India) Ltd, a micro-cap player in the petrochemicals sector, has seen its valuation grade improve from expensive to fair, reflecting a notable shift in price attractiveness despite ongoing challenges in profitability and returns. This article analyses the recent changes in key valuation parameters, compares them with peer averages and historical benchmarks, and assesses the implications for investors.
Read full news article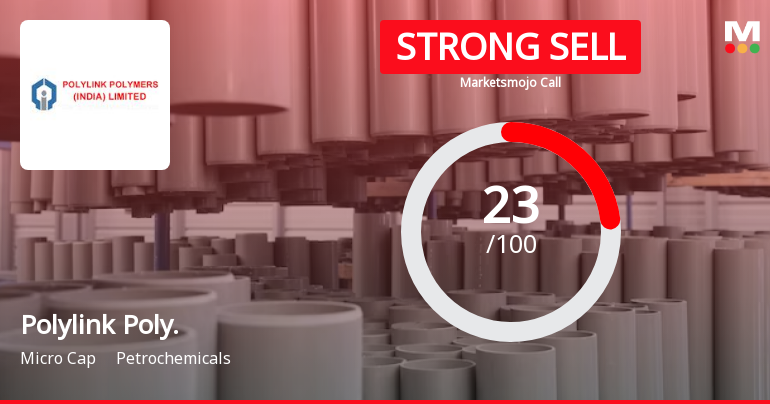
Polylink Polymers (India) Ltd is Rated Strong Sell
Polylink Polymers (India) Ltd is rated Strong Sell by MarketsMOJO. This rating was last updated on 23 May 2025. However, the analysis and financial metrics presented here reflect the stock's current position as of 30 June 2026, providing investors with the latest insights into the company’s performance and outlook.
Read full news article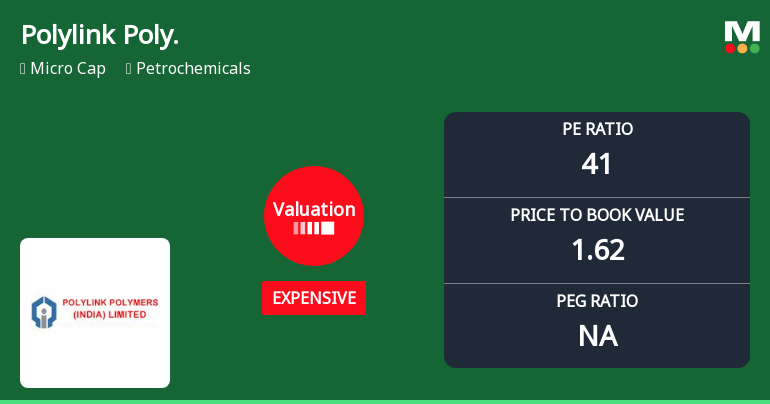
Polylink Polymers Valuation Shifts Signal Price Attractiveness Challenges
Polylink Polymers (India) Ltd has witnessed a marked shift in its valuation parameters, moving from a fair to an expensive rating, raising concerns about its price attractiveness amid subdued profitability and a challenging sector backdrop. Despite a recent surge in share price, the company’s elevated price-to-earnings and price-to-book ratios, coupled with weak return metrics, suggest caution for investors seeking value in the petrochemicals space.
Read full news article Announcements
Closure of Trading Window
26-Jun-2026 | Source : BSEThe Trading window for dealing in securities of the company will be closed from 01 July 2026 till 48 hours after the declaration of Unaudited Financial Results of the Company for the quarter ending on 30 June 2026.
Compliances-Reg.24(A)-Annual Secretarial Compliance
29-May-2026 | Source : BSEPlease find enclosed Annual Secretarial Compliance Report issued by M/s. A G Shah & Associates for the Financial Year ended on 31st March 2026
Audited Financial Results For The Quarter And Year Ended 31St March 2026
29-May-2026 | Source : BSEAudited Financial Results of the Company for the Quarter and Financial Year Ended on 31st March 2026 along with Statement of Asset & Liability and Cash Flow Statement of the Company as at 31st March 2026.
Corporate Actions

No Upcoming Board Meetings

No Dividend history available

Polylink Polymers (India) Ltd has announced 5:10 stock split, ex-date: 22 Dec 11

No Bonus history available

No Rights history available
Quality key factors
Valuation key factors
Technicals key factors
 Technical Indicator Scale: Bearish, Mildly Bearish, Sideways, Mildly Bullish, Bullish Turned
 Shareholding Snapshot : Mar 2026
Shareholding Compare (%holding)
Promoters
None
Held by 0 Schemes
Held by 0 FIIs
Hwl Traders Limited (60.5%)
Hitesh Ramji Javeri (3.18%)
24.49%
Quarterly Results Snapshot (Standalone) - Mar'26 - QoQ

QoQ Growth in quarter ended Mar 2026 is 5.40% vs -6.66% in Dec 2025
QoQ Growth in quarter ended Mar 2026 is 154.17% vs 33.33% in Dec 2025
Half Yearly Results Snapshot (Standalone) - Sep'25

Growth in half year ended Sep 2025 is -5.56% vs 34.39% in Sep 2024
Growth in half year ended Sep 2025 is -71.32% vs 163.27% in Sep 2024
Nine Monthly Results Snapshot (Standalone) - Dec'25
YoY Growth in nine months ended Dec 2025 is -6.80% vs 28.89% in Dec 2024
YoY Growth in nine months ended Dec 2025 is -72.77% vs 138.30% in Dec 2024
Annual Results Snapshot (Standalone) - Mar'26
YoY Growth in year ended Mar 2026 is -7.67% vs 22.12% in Mar 2025
YoY Growth in year ended Mar 2026 is -42.72% vs 23.12% in Mar 2025
About Polylink Polymers (India) Ltd

Company Coordinates


