
Compare Polylink Poly. with Similar Stocks
Dashboard
Weak Long Term Fundamental Strength with an average Return on Equity (ROE) of 4.65%
- Poor long term growth as Operating profit has grown by an annual rate 5.56% of over the last 5 years
- Company's ability to service its debt is weak with a poor EBIT to Interest (avg) ratio of 1.71
Flat results in Mar 26
Consistent Underperformance against the benchmark over the last 3 years
Total Returns (Price + Dividend) 
Polylink Poly. for the last several years.
Risk Adjusted Returns v/s
Returns Beta

News

Polylink Polymers (India) Ltd is Rated Strong Sell
Polylink Polymers (India) Ltd is rated Strong Sell by MarketsMOJO. This rating was last updated on 23 May 2025. However, the analysis and financial metrics discussed here reflect the stock's current position as of 18 June 2026, providing investors with an up-to-date perspective on the company’s performance and outlook.
Read full news article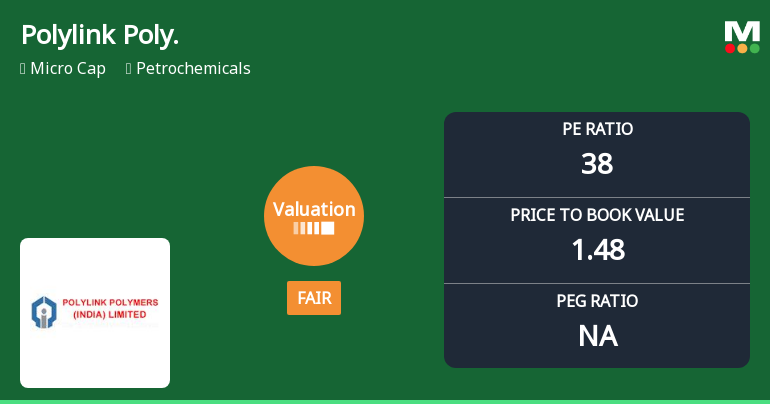
Polylink Polymers Valuation Shifts to Fair Amid Mixed Performance
Polylink Polymers (India) Ltd has experienced a notable shift in its valuation parameters, moving from an expensive to a fair valuation grade. Despite a recent downgrade in its Mojo Grade to Strong Sell, the company’s price-to-earnings (P/E) and price-to-book value (P/BV) ratios suggest a recalibration of market expectations amid challenging sector dynamics and peer comparisons.
Read full news article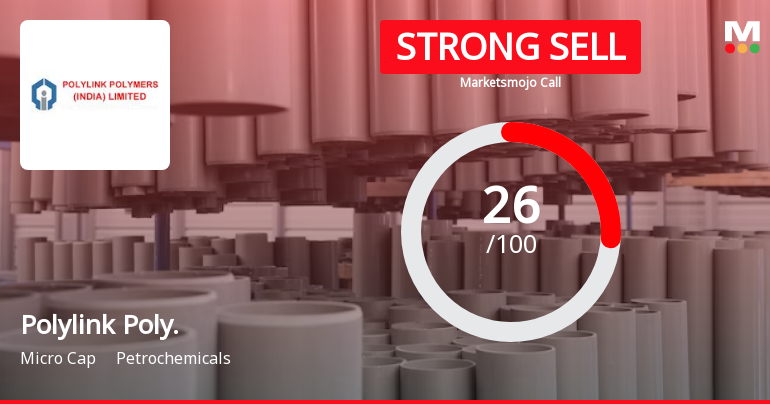
Polylink Polymers (India) Ltd is Rated Strong Sell
Polylink Polymers (India) Ltd is rated Strong Sell by MarketsMOJO. This rating was last updated on 23 May 2025. However, the analysis and financial metrics presented here reflect the stock’s current position as of 04 June 2026, providing investors with the latest insights into the company’s performance and outlook.
Read full news article Announcements
Compliances-Reg.24(A)-Annual Secretarial Compliance
29-May-2026 | Source : BSEPlease find enclosed Annual Secretarial Compliance Report issued by M/s. A G Shah & Associates for the Financial Year ended on 31st March 2026
Audited Financial Results For The Quarter And Year Ended 31St March 2026
29-May-2026 | Source : BSEAudited Financial Results of the Company for the Quarter and Financial Year Ended on 31st March 2026 along with Statement of Asset & Liability and Cash Flow Statement of the Company as at 31st March 2026.
Board Meeting Outcome for Outcome Of Board Meeting Pursuant To Regulation 30 And 33 Of SEBI (Listing Obligations And Disclosure Requirements) Regulations 2015 (Listing Regulation)
29-May-2026 | Source : BSEOutcome of Board Meeting held on 29th May 2026 interalia to consider and approve Audited Financial Results for the Quarter and year ended on 31st March 2026 along with Independent Auditors report thereon.
Corporate Actions

No Upcoming Board Meetings

No Dividend history available

Polylink Polymers (India) Ltd has announced 5:10 stock split, ex-date: 22 Dec 11

No Bonus history available

No Rights history available
Quality key factors
Valuation key factors
Technicals key factors
 Technical Indicator Scale: Bearish, Mildly Bearish, Sideways, Mildly Bullish, Bullish Turned
 Shareholding Snapshot : Mar 2026
Shareholding Compare (%holding)
Promoters
None
Held by 0 Schemes
Held by 0 FIIs
Hwl Traders Limited (60.5%)
Hitesh Ramji Javeri (3.18%)
24.49%
Quarterly Results Snapshot (Standalone) - Mar'26 - QoQ

QoQ Growth in quarter ended Mar 2026 is 5.40% vs -6.66% in Dec 2025
QoQ Growth in quarter ended Mar 2026 is 154.17% vs 33.33% in Dec 2025
Half Yearly Results Snapshot (Standalone) - Sep'25

Growth in half year ended Sep 2025 is -5.56% vs 34.39% in Sep 2024
Growth in half year ended Sep 2025 is -71.32% vs 163.27% in Sep 2024
Nine Monthly Results Snapshot (Standalone) - Dec'25
YoY Growth in nine months ended Dec 2025 is -6.80% vs 28.89% in Dec 2024
YoY Growth in nine months ended Dec 2025 is -72.77% vs 138.30% in Dec 2024
Annual Results Snapshot (Standalone) - Mar'26
YoY Growth in year ended Mar 2026 is -7.67% vs 22.12% in Mar 2025
YoY Growth in year ended Mar 2026 is -42.72% vs 23.12% in Mar 2025
About Polylink Polymers (India) Ltd

Company Coordinates


