
Compare Ajcon Global with Similar Stocks
Dashboard
With a Operating Losses, the company has a Weak Long Term Fundamental Strength
- Poor long term growth as Net Sales has grown by an annual rate of -5.75% and Operating profit at -13.80%
With ROE of 0.9, it has a Very Expensive valuation with a 1.6 Price to Book Value
Underperformed the market in the last 1 year
Stock DNA
Non Banking Financial Company (NBFC)
INR 38 Cr (Micro Cap)
166.00
21
0.00%
0.38
0.95%
1.58
Total Returns (Price + Dividend) 
Latest dividend: 0.4700 per share ex-dividend date: Feb-06-2008
Risk Adjusted Returns v/s
Returns Beta

News

Ajcon Global Services Ltd is Rated Strong Sell
Ajcon Global Services Ltd is rated Strong Sell by MarketsMOJO, with this rating last updated on 21 April 2026. However, the analysis and financial metrics discussed here reflect the stock’s current position as of 18 June 2026, providing investors with the latest insights into the company’s performance and outlook.
Read full news articleAre Ajcon Global Services Ltd latest results good or bad?
Ajcon Global Services Ltd's latest financial results for Q4 FY26 present a complex picture characterized by significant revenue growth juxtaposed with a notable decline in profitability. The company's net sales surged to ₹19.80 crores, reflecting a remarkable 464.10% increase quarter-on-quarter, marking the highest quarterly revenue in its recent history. This surge suggests a substantial transaction or a shift in revenue recognition patterns. However, this impressive top-line growth is overshadowed by a concerning profitability scenario. The company reported a net loss of ₹0.50 crores, representing a drastic decline in net profit compared to the previous quarter, where it had achieved a profit of ₹0.25 crores. The operating margin fell sharply to -2.11% from 17.0% in the prior quarter, indicating that the costs associated with generating this revenue have significantly outpaced the income generated. This ...
Read full news article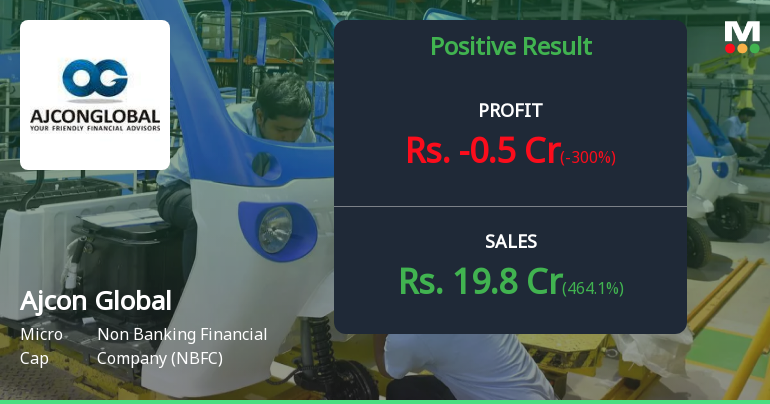
Ajcon Global Q4 FY26: Sharp Profit Decline Raises Serious Concerns About Business Sustainability
Ajcon Global Services Ltd., a Mumbai-based non-banking financial company (NBFC), reported deeply troubling results for Q4 FY26 (January-March 2026), with consolidated net profit collapsing to a loss of ₹0.50 crores compared to a profit of ₹0.25 crores in Q3 FY26—a sequential decline of 300.00%. Year-on-year, the company posted a 35.06% decline from a loss of ₹0.77 crores in Q4 FY25, though the magnitude of losses remains concerning for this ₹42.00 crore market capitalisation micro-cap company.
Read full news article Announcements
Audited Financial Results 31.03.2026
30-May-2026 | Source : BSEAudited Financial Results (Standalone & Consolidated) for the quarter ended 31.03.2026
Announcement under Regulation 30 (LODR)-Newspaper Publication
23-May-2026 | Source : BSENewspaper Publication of Audited Financial Results (Standalone & Consolidated) for the quarter and year ended 31st March 2026
Non-Applicability Certificate Of RPT
22-May-2026 | Source : BSENon-Applicability Certificate of RTP for the period ended 31.03.2026
Corporate Actions

No Upcoming Board Meetings

Ajcon Global Services Ltd has declared 5% dividend, ex-date: 06 Feb 08

Ajcon Global Services Ltd has announced 1:10 stock split, ex-date: 20 Jun 25

No Bonus history available

No Rights history available
Quality key factors
Valuation key factors
Technicals key factors
 Technical Indicator Scale: Bearish, Mildly Bearish, Sideways, Mildly Bullish, Bullish Turned
 Shareholding Snapshot : Mar 2026
Shareholding Compare (%holding)
Promoters
None
Held by 2 Schemes (0.85%)
Held by 0 FIIs
Ashok Manikchand Ajmera (12.26%)
Pushpanjali Tie-up Private Limited (0%)
22.61%
Quarterly Results Snapshot (Consolidated) - Mar'26 - QoQ

QoQ Growth in quarter ended Mar 2026 is 464.10% vs -66.70% in Dec 2025

QoQ Growth in quarter ended Mar 2026 is -300.00% vs -13.79% in Dec 2025
Half Yearly Results Snapshot (Consolidated) - Sep'25
Growth in half year ended Sep 2025 is 26.81% vs 7.68% in Sep 2024
Growth in half year ended Sep 2025 is -55.66% vs 23.26% in Sep 2024
Nine Monthly Results Snapshot (Consolidated) - Dec'25
YoY Growth in nine months ended Dec 2025 is 20.72% vs 3.53% in Dec 2024
YoY Growth in nine months ended Dec 2025 is -45.45% vs 14.78% in Dec 2024
Annual Results Snapshot (Consolidated) - Mar'26
YoY Growth in year ended Mar 2026 is 118.67% vs 3.81% in Mar 2025
YoY Growth in year ended Mar 2026 is -57.41% vs -56.80% in Mar 2025
About Ajcon Global Services Ltd

Company Coordinates


