
Compare Ajcon Global with Similar Stocks
Dashboard
With a Operating Losses, the company has a Weak Long Term Fundamental Strength
- Poor long term growth as Net Sales has grown by an annual rate of -5.75% and Operating profit at -13.80%
With ROE of 0.9, it has a Very Expensive valuation with a 1.5 Price to Book Value
Underperformed the market in the last 1 year
Stock DNA
Non Banking Financial Company (NBFC)
INR 35 Cr (Micro Cap)
155.00
21
0.00%
0.38
0.95%
1.50
Total Returns (Price + Dividend) 
Latest dividend: 0.4700 per share ex-dividend date: Feb-06-2008
Risk Adjusted Returns v/s
Returns Beta

News
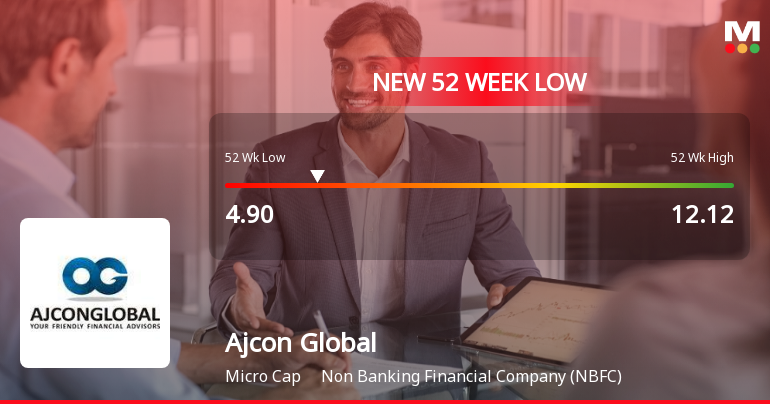
Five Consecutive Losses Push Ajcon Global Services Ltd to a New 52-Week Low
For the fifth consecutive session, Ajcon Global Services Ltd has closed lower, slipping to a fresh 52-week low of Rs 4.9 on 14 Jul 2026. This decline comes amid a broader market pullback, but the stock’s underperformance is notably sharper than its peers and the benchmark indices.
Read full news article
Ajcon Global Services Ltd is Rated Strong Sell
Ajcon Global Services Ltd is rated Strong Sell by MarketsMOJO, with this rating last updated on 21 April 2026. However, the analysis and financial metrics discussed here reflect the stock's current position as of 02 July 2026, providing investors with the latest insights into its performance and outlook.
Read full news article
Ajcon Global Services Ltd is Rated Strong Sell
Ajcon Global Services Ltd is rated Strong Sell by MarketsMOJO, with this rating last updated on 21 April 2026. However, the analysis and financial metrics discussed here reflect the stock’s current position as of 18 June 2026, providing investors with the latest insights into the company’s performance and outlook.
Read full news article Announcements
Regulation 74(5) Of The SEBI (DP) Regulation 2018_ Compliance Certificate
06-Jul-2026 | Source : BSERegulation 74 (5) of the SEBI (D&P) Regulations 2018 _ Compliance Certificate for the Quarter ended 30.06.2026
Announcement under Regulation 30 (LODR)-Newspaper Publication
25-Jun-2026 | Source : BSENewspaper Advertisement regarding 39th AGM Notice of the Company
Physical Letter Sent To Shareholders
25-Jun-2026 | Source : BSECompany has dispatched Physical letter on 24.06.2026 to those Shareholders whose email IDs are not registered with Company/RTA/DP providing Weblink of Companys Website from where the Notice of 39th Annual General Meeting alongwith Annual Report for FY 2025-26 can be accessed.
Corporate Actions

No Upcoming Board Meetings

Ajcon Global Services Ltd has declared 5% dividend, ex-date: 06 Feb 08

Ajcon Global Services Ltd has announced 1:10 stock split, ex-date: 20 Jun 25

No Bonus history available

No Rights history available
Quality key factors
Valuation key factors
Technicals key factors
 Technical Indicator Scale: Bearish, Mildly Bearish, Sideways, Mildly Bullish, Bullish Turned
 Shareholding Snapshot : Jun 2026
Shareholding Compare (%holding)
Promoters
None
Held by 2 Schemes (0.85%)
Held by 0 FIIs
Ashok Manikchand Ajmera (12.26%)
Pushpanjali Tie-up Private Limited (2.06%)
22.62%
Quarterly Results Snapshot (Consolidated) - Mar'26 - QoQ

QoQ Growth in quarter ended Mar 2026 is 464.10% vs -66.70% in Dec 2025

QoQ Growth in quarter ended Mar 2026 is -300.00% vs -13.79% in Dec 2025
Half Yearly Results Snapshot (Consolidated) - Sep'25
Growth in half year ended Sep 2025 is 26.81% vs 7.68% in Sep 2024
Growth in half year ended Sep 2025 is -55.66% vs 23.26% in Sep 2024
Nine Monthly Results Snapshot (Consolidated) - Dec'25
YoY Growth in nine months ended Dec 2025 is 20.72% vs 3.53% in Dec 2024
YoY Growth in nine months ended Dec 2025 is -45.45% vs 14.78% in Dec 2024
Annual Results Snapshot (Consolidated) - Mar'26
YoY Growth in year ended Mar 2026 is 118.67% vs 3.81% in Mar 2025
YoY Growth in year ended Mar 2026 is -57.41% vs -56.80% in Mar 2025
About Ajcon Global Services Ltd

Company Coordinates


