
Dashboard
Weak Long Term Fundamental Strength with a -42.11% CAGR growth in Operating Profits over the last 5 years
- Company's ability to service its debt is weak with a poor EBIT to Interest (avg) ratio of -6.04
- The company has been able to generate a Return on Equity (avg) of 1.43% signifying low profitability per unit of shareholders funds
Underperformed the market in the last 1 year
Stock DNA
Computers - Software & Consulting
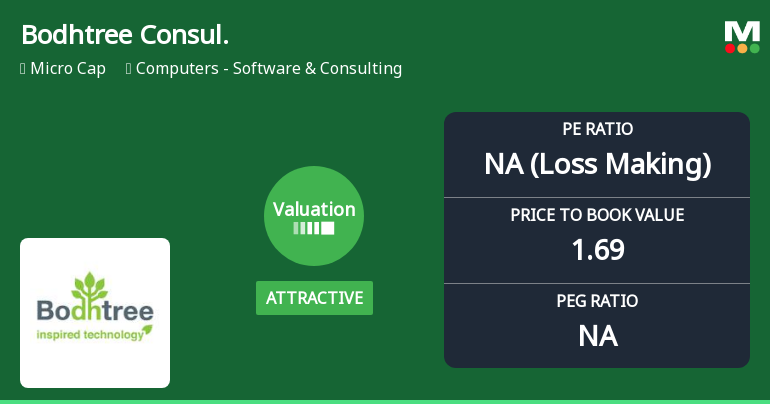
INR 42 Cr (Micro Cap)
NA (Loss Making)
20
0.00%
-0.29
6.10%
1.69
Total Returns (Price + Dividend) 
Latest dividend: 0.7 per share ex-dividend date: Sep-10-2018
Risk Adjusted Returns v/s
Returns Beta

News
Bodhtree Consulting Ltd Valuation Shifts Signal Renewed Price Attractiveness
Bodhtree Consulting Ltd has witnessed a notable shift in its valuation parameters, moving from a very attractive to an attractive rating, signalling a potential change in price appeal for investors. Despite a challenging year-to-date performance, the micro-cap software and consulting firm’s improved price-to-book and price-to-earnings ratios relative to peers suggest a nuanced opportunity amid sector volatility.
Read full news article
Bodhtree Consulting Ltd is Rated Sell
Bodhtree Consulting Ltd is rated 'Sell' by MarketsMOJO, with this rating last updated on 19 May 2026. While the rating change occurred on that date, all fundamentals, returns, and financial metrics discussed here reflect the company’s current position as of 18 June 2026.
Read full news article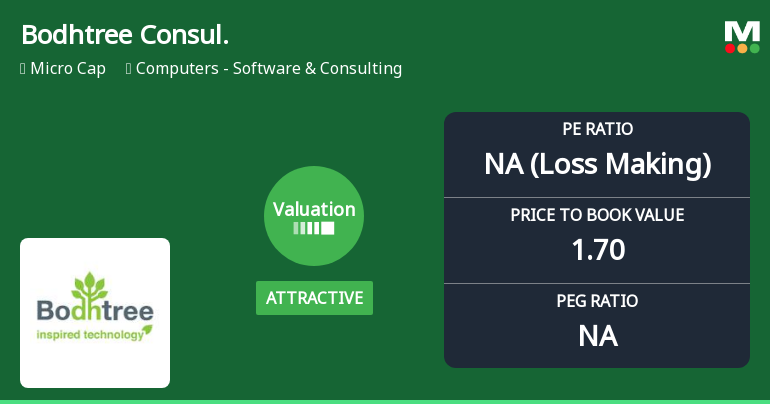
Bodhtree Consulting Ltd Valuation Shifts Signal Renewed Price Attractiveness
Bodhtree Consulting Ltd has witnessed a notable shift in its valuation parameters, moving from a very attractive to an attractive rating, reflecting evolving market perceptions amid mixed financial metrics and sector comparisons. This article analyses the recent changes in price-to-earnings and price-to-book value ratios, alongside peer benchmarks and historical trends, to assess the stock’s current price attractiveness and investment appeal.
Read full news article Announcements
Shareholder Meeting / Postal Ballot-Scrutinizers Report
24-May-2026 | Source : BSEPlease find enclosed the Scrutinizer Report for the Postal Ballot.
Shareholder Meeting / Postal Ballot-Outcome of Postal_Ballot
24-May-2026 | Source : BSEOutcome and Voting Results of the Postal Ballot
Announcement under Regulation 30 (LODR)-Newspaper Publication
20-May-2026 | Source : BSENewspaper publication of Audited Financial Results for the quarter and year ended March 31 2026.
Corporate Actions

No Upcoming Board Meetings

Bodhtree Consulting Ltd has declared 7% dividend, ex-date: 10 Sep 18

No Splits history available

No Bonus history available

No Rights history available
Quality key factors
Valuation key factors
Technicals key factors
 Technical Indicator Scale: Bearish, Mildly Bearish, Sideways, Mildly Bullish, Bullish Turned
 Shareholding Snapshot : Mar 2026
Shareholding Compare (%holding)
Promoters
None
Held by 0 Schemes
Held by 0 FIIs
Prem Anandh (54.88%)
Micro Sparks Venture Llp (1.2%)
19.95%
Quarterly Results Snapshot (Standalone) - Mar'26 - YoY

YoY Growth in quarter ended Mar 2026 is 1,186.15% vs -94.65% in Mar 2025
YoY Growth in quarter ended Mar 2026 is 113.25% vs 4.60% in Mar 2025
Half Yearly Results Snapshot (Standalone) - Sep'25
Growth in half year ended Sep 2025 is 294.96% vs -33.49% in Sep 2024
Growth in half year ended Sep 2025 is 145.34% vs -65.98% in Sep 2024
Nine Monthly Results Snapshot (Standalone) - Dec'25
YoY Growth in nine months ended Dec 2025 is 103.87% vs 23.13% in Dec 2024
YoY Growth in nine months ended Dec 2025 is 406.98% vs 72.96% in Dec 2024
Annual Results Snapshot (Standalone) - Mar'26
YoY Growth in year ended Mar 2026 is 220.10% vs -63.35% in Mar 2025
YoY Growth in year ended Mar 2026 is 212.60% vs 48.37% in Mar 2025
About Bodhtree Consulting Ltd

Company Coordinates


